


AI in Commercial Real Estate

September 14, 2026
AI in Commercial Real Estate
September 14, 2026
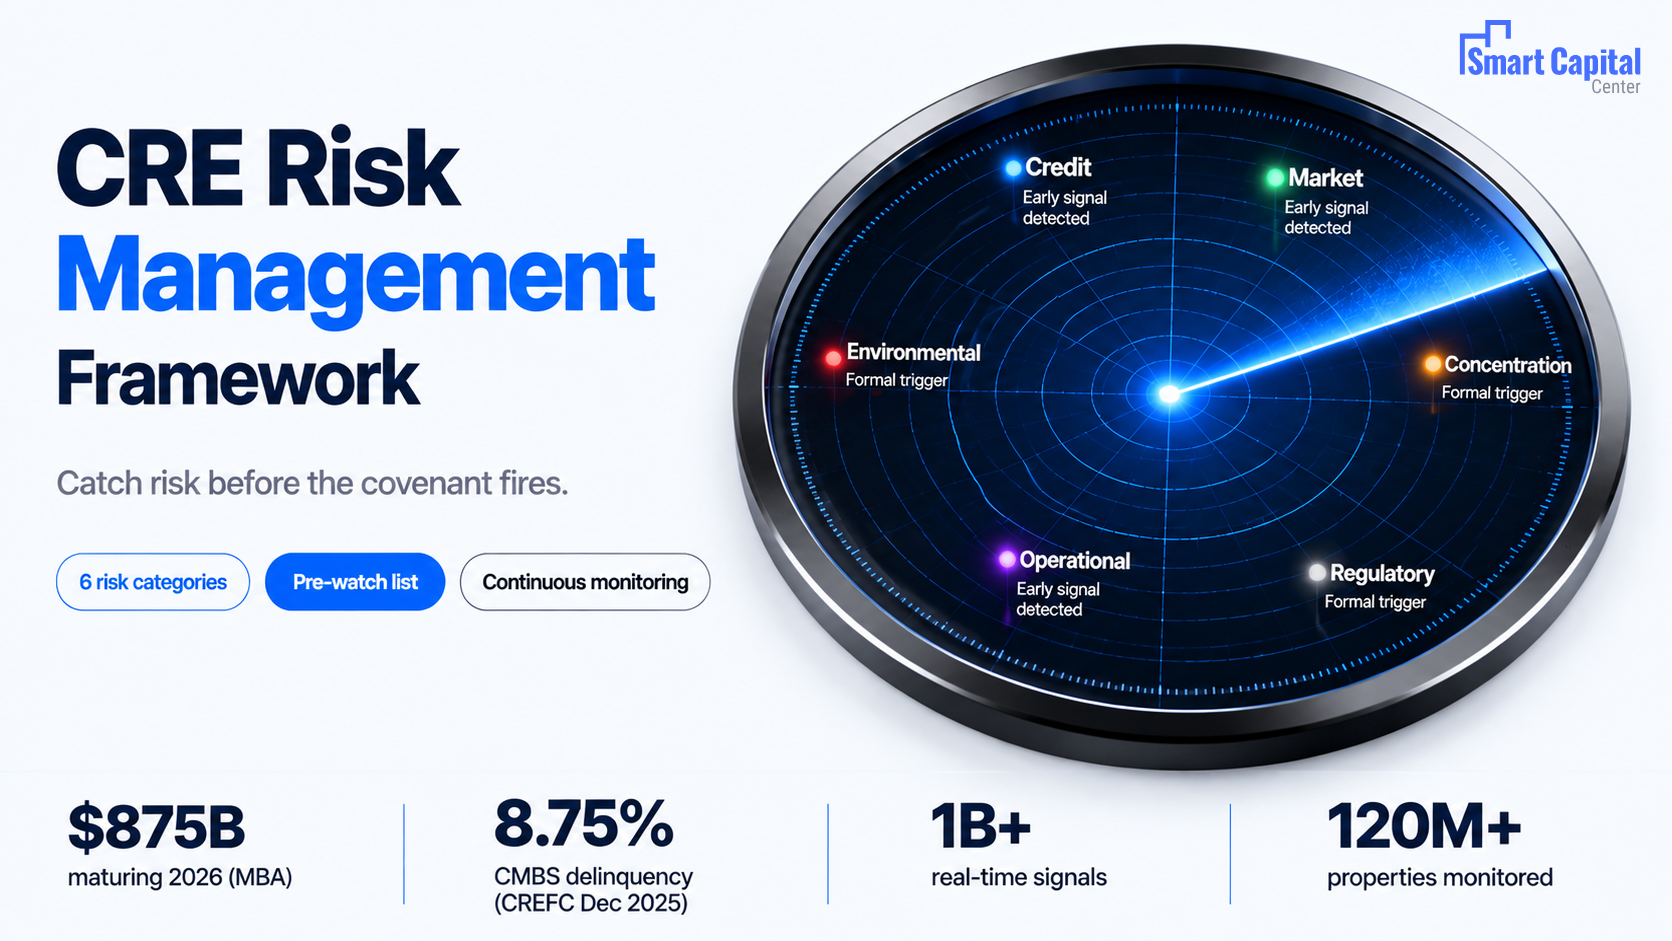
CRE risk management works when signals arrive early enough to act on. Smart Capital Center gives lenders and investors continuous monitoring across credit, market, operational, environmental, regulatory, and concentration risk, surfacing signals weeks or months before they hit formal triggers. That lead time changes the workout math and preserves borrower options. The OCC's Fall 2025 Semiannual Risk Perspective flagged that credit conditions and refinancing risk in certain segments of commercial real estate lending and private credit markets warrant ongoing monitoring, and the firms best positioned to respond are the ones with the data infrastructure to see the risk building, not just to confirm it after the fact.
Three conditions are compressing the margin for error in CRE risk management simultaneously. First, the maturity volume: $875B in 2026 and $652B in 2027, per MBA data, creates workout triage at a scale most risk teams were not sized to handle. Second, the examiner posture: the OCC’s Fall 2025 Semiannual Risk Perspective (December 2025) identified CRE credit conditions as a named monitoring priority, meaning examiners are specifically reviewing whether risk identification, documentation, and escalation practices are adequate. Third, the data lag: the FDIC’s Q3 2025 Quarterly Banking Profile found that the non-owner-occupied CRE past-due and nonaccrual rate at large banks remained well above its pre-pandemic average despite declining from its 4.99% peak in Q3 2024. This signals that legacy stress is still working through the system.
“Leaders still see commercial real estate as potentially a safe investment haven, given its performance during similar periods of uncertainty in the past.” – Sally Ann Flood, Vice Chair & U.S. Real Estate Sector Leader, Deloitte (2026 Commercial Real Estate Outlook)
The market is recovering, but it is not uniform. Sally Ann Flood’s observation reflects institutional confidence that is real and data-supported. It also reflects a market where CRE risk factors are more dispersed by asset class, submarket, and vintage than any portfolio-average metric can capture.

Debt service coverage ratio (DSCR): a property’s net operating income divided by total debt service. The primary lender covenant metric: most lenders require a minimum of 1.20x–1.35x, tested quarterly or semi-annually.
Loan-to-value (LTV): the ratio of loan balance to property value. Monitored throughout the loan term, a property’s value can decline significantly without any change in the loan balance.
Concentration risk: the risk that exposure to a single tenant, borrower, submarket, or asset class becomes large enough to threaten portfolio-level outcomes. Invisible at the asset level; only visible in aggregate.
Pre-watch list: a tier of loans flagged for closer attention before formal covenant triggers hit, based on early-warning signals at the tenant, property, or market level. Where the most productive risk interventions occur.
Covenant trigger: the specific threshold at which a covenant is considered breached, activating remedies under the loan agreement. A lagging indicator: by the time it fires, deterioration has typically been underway for 2–6 quarters.
Credit risk is the risk that a borrower fails to perform through non-payment, covenant breach, or inability to refinance at maturity. The CREFC December 2025 Monthly CMBS Loan Performance Report documented an effective delinquency rate of approximately 8.75% when performing matured balloons are included, with extension and modification activity masking underlying stress. Credit risk is directional. A DSCR declining from 1.31x to 1.28x to 1.26x over three quarters carries a signal that binary covenant testing misses until the threshold is crossed.
Market risk in CRE risk management is the risk that changes in market conditions: cap rate expansion, rent growth shortfall, supply shock, or demand shift, erode property values or income projections that were assumed at origination. It is the most consistently under-monitored risk category because it does not appear in borrower financial statements until conditions have already moved.
“The data from this survey show that 2025 was a transition year, with the maturity wall shrinking after several years where the wall of scheduled maturities had been increasing… lenders were no longer simply extending loan terms.” – Mike Fratantoni, Chief Economist, MBA (2026 CREF Convention)
A multifamily loan underwritten at 4.75% in a submarket repriced to 5.75% carries an implied LTV 15–20% higher with no change in the borrower's statements. Smart Capital Center gives lenders and investors the lead time to act on risk before it hits a covenant, continuously monitoring cap rate, rent, and vacancy conditions across 120M+ properties and flagging when origination-era assumptions have diverged significantly.
A tenant representing 9% of NOI at one property is manageable. The same tenant across four properties is a 36% portfolio concentration that no individual loan file review surfaces. Smart Capital Center maps cross-property tenant concentration in absolute NOI terms simultaneously across the full portfolio: a natural-language query returns a ranked answer in seconds.
Operational risk surfaces in CRE as document extraction errors flowing into financial models, reconciliation gaps between borrower submissions and the monitoring system, alert routing failures, and audit trail gaps that surface during examination. Smart Capital Center flags low-confidence extractions for analyst review, routes every alert with a timestamp and loan record attached, and generates an exportable audit trail satisfying OCC and FDIC examination standards without manual reconstruction.
Environmental risk evolves after origination: flood zone maps are remapped, regulatory designations change, adjacent parcel contamination is discovered. A Phase I from three years ago does not capture those changes. The most commonly missed ongoing exposure is flood zone reclassification: a property reclassified into a Special Flood Hazard Area adds material NFIP insurance cost that directly reduces NOI and DSCR. Large portfolios need systematic monitoring.
Regulatory risk in CRE risk management is the risk that examination findings, supervisory actions, or compliance failures impose costs, restrict business activity, or create reputational exposure. The OCC’s Fall 2025 Semiannual Risk Perspective (December 2025) identified CRE credit conditions and refinancing risk as requiring ongoing monitoring, a signal that examiners are specifically reviewing whether institutions can demonstrate consistent application of credit standards and whether risk identification documentation is current and complete.
The standard is precise: for any flagged risk, examiners expect to see who identified it, when, against what data, and what action followed. Smart Capital Center produces this documentation continuously as a byproduct of normal monitoring: timestamped, field-level, and exportable without reconstruction from email archives.
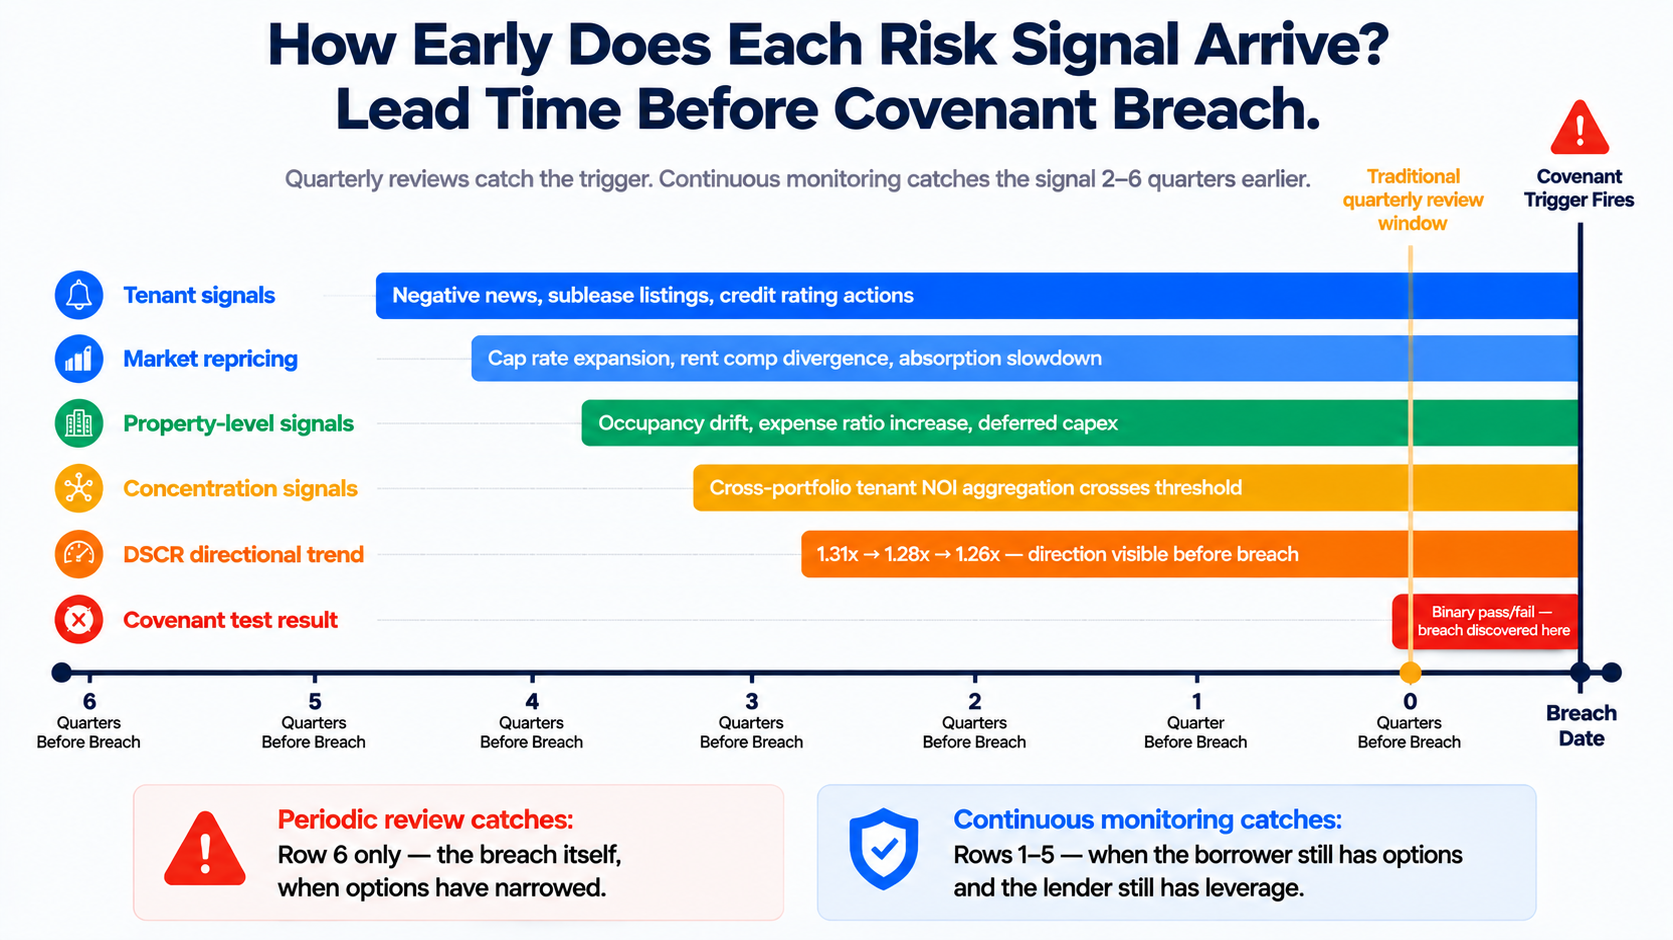
The table above captures the operational gap that defines CRE risk management in 2026. Quarterly reviews miss between-cycle changes. Tenant bankruptcies do not wait for the next scheduled financial statement review. Cap rate moves do not align with appraisal cycles. Covenant tests that fire binary pass/fail at scheduled dates miss the directional trend that has been building for three quarters before the threshold is crossed. Continuous monitoring ensures that analyst judgment is applied to the right loans at the right moment, not uniformly across the full portfolio at the next reporting cycle.
The pre-watch list is the most operationally valuable tier in a CRE risk management framework because it is where the lender still has leverage. A borrower on the pre-watch list, flagged by directional DSCR decline, a tenant news event, or a market repricing signal, still has options: they can source equity, restructure a lease, negotiate modified terms from a position that is not yet adversarial. A borrower on the formal watch list is already negotiating against a triggered default.
The pre-watch list requires three things to function: signal thresholds defined before any loan enters monitoring (not set reactively when a borrower calls); automated monitoring that fires alerts when those thresholds are approached; and alert routing that reaches the right team member with the loan context attached.
Smart Capital Center fires pre-breach alerts when a metric enters the warning zone, when DSCR cushion narrows below a configurable threshold, when a tenant with significant portfolio NOI exposure generates a negative news flag, or when a submarket cap rate diverges significantly from the origination-era assumption. Every alert links to the source data that triggered it.

1. Define signal thresholds for each risk category before any loan enters the portfolio. Establish specific pre-watch values at each layer: DSCR cushion below 15%, tenant NOI exposure above 8% with a negative news flag, cap rate divergence above 50 bps from origination assumption, LTV above 70% with a declining value signal. Without defined thresholds, monitoring is triage.
2. Map cross-portfolio concentration before building any individual asset risk score. Concentration risk is invisible in asset-level reporting. Before any framework is operational, establish the baseline: which tenants appear across multiple properties, their aggregate NOI share, and which submarkets or sectors exceed defined thresholds.
3. Connect monitoring alerts to analyst tasks with a defined response protocol. An alert is only useful if it produces an action. Define what each type triggers: a 10%+ NOI tenant news alert reaches the senior credit officer within 24 hours; an occupancy discrepancy flag reaches the asset manager within 5 business days. Smart Capital Center routes every alert to the assigned team member with the loan record attached.
4. Build the audit trail into the monitoring workflow. Examiners expect to see who identified a risk, when, against what data, and what followed. A process that produces this continuously is examination-ready. Smart Capital Center's audit trail is continuous, field-level, and exportable without reconstruction.
5. Run a natural-language portfolio query before every formal review cycle to set the agenda. Query the portfolio before assembling the quarterly report: "Which loans have DSCR cushion below 10%?" "Which tenants with 5%+ NOI exposure had negative news in the last 90 days?" Smart Capital Center answers across the full portfolio in seconds, turning the review into a prioritized agenda.
The firms managing the lowest credit loss rates in the 2026 maturity cycle are those whose risk monitoring surfaces deterioration early enough that intervention is still productive.
Smart Capital Center’s continuous commercial real estate risk management layer monitors every tenant, every property, and every market signal simultaneously, flags concentration risk in absolute income terms across the full portfolio, and routes every alert to the right team member with source-traceable data attached. The audit trail is continuous, satisfying OCC and FDIC examination standards without the manual assembly step that most portfolio teams currently spend their reporting cycles on.
See what zero reporting lag looks like across your full portfolio. Book a demo with Smart Capital Center.
The six primary CRE risk factors are: credit (borrower non-performance, covenant breach), market (cap rate expansion, rent shortfall), concentration (single tenant or submarket too large a share of portfolio income), operational (process failure, audit trail gaps), environmental (contamination, flood zone reclassification), and regulatory (examination findings from inadequate documentation). In practice, these risks interact: market stress in a concentrated submarket compounds exposure before either signal surfaces in reporting.
At the loan level: DSCR (NOI divided by debt service) and LTV (loan balance divided by current value). At the portfolio level: concentration exposure in absolute NOI terms by tenant, submarket, and asset class; directional DSCR trend across the cohort; and the share of the portfolio on pre-watch or formal watch. Binary pass/fail covenant testing at scheduled dates systematically misses the directional signals that predict breach 2–6 quarters in advance.
A pre-watch list flags loans for closer attention before formal covenant triggers hit, based on early-warning signals at the tenant, property, or market level. It matters because a borrower on the pre-watch list still has options: sourcing equity, restructuring a lease, negotiating proactively. By the formal watch list, those options have narrowed to workout paths that are more expensive for both sides. Building one requires continuous monitoring, because the signals arrive 2–6 quarters before the trigger fires.
AI improves CRE risk management in three ways: continuous monitoring between reporting cycles (tenant news, market repricing, occupancy discrepancies); portfolio-level aggregation (cross-property concentration in absolute NOI terms, natural-language queries across the full portfolio); and pre-breach alerting (fires when a metric approaches its threshold). Smart Capital Center delivers all three across 120M+ properties and 1B+ real-time signals.
Concentration risk is the risk that exposure to a single tenant, borrower, submarket, or asset class becomes large enough to threaten portfolio-level outcomes. It is invisible at the asset level: a tenant at 9% NOI in one property is manageable; the same tenant across four properties is a 36% portfolio concentration. Effective monitoring requires portfolio-level aggregation in absolute income terms updated in real time.
The framework is the same: both monitor credit, market, concentration, operational, environmental, and regulatory risk. The difference is perspective: lenders protect fixed-income collateral and face examiner oversight; investors protect equity returns and face LP and IC reporting obligations. Lenders weight credit risk and documentation most heavily; investors weight market and concentration risk. The operational monitoring infrastructure is the same regardless of which side of the capital stack.