


AI in Commercial Real Estate

October 1, 2026
AI in Commercial Real Estate
October 1, 2026
According to Hughes, Samuel K., and Joseph B. Nichols (2025). “No News is Bad News: Monitoring, Risk, and Stale Financial Performance in Commercial Real Estate,” Finance and Economics Discussion Series 2025-032. Washington: Board of Governors of the Federal Reserve System, banks that rely on borrower-reported performance data are slower to update loan risk ratings as information becomes stale, and borrowers with stale financials are measurably more likely to default. T
he implication is direct: periodic review cycles, the standard operating model for most CRE portfolio monitoring programs, systematically lag the deterioration they are designed to catch. By the time a covenant trips and a formal watch-list designation follows, the window where intervention changes outcomes has often already closed. As MBA Chief Economist Mike Fratantoni observed at the 2026 CREF Convention, “$875 billion in scheduled maturities in 2026 and $652 billion in 2027 will fuel additional lending activity” – pressure that shows up in portfolios well before it hits a covenant.
This analysis draws on Smart Capital Center, a CRE AI platform monitoring 1B+ real-time market signals across 120M+ properties, used by JLL, KeyBank, and leading institutional lenders, to map how continuous, signal-based portfolio risk monitoring catches deterioration before it becomes a formal credit event.
A covenant breach is the end of a deterioration process that typically began quarters earlier. Cap rates adjusted faster than NOI in the 2022–2024 rate cycle, compressing values mechanically before income metrics moved. According to the GAO’s September 2024 CRE report (GAO-24-107282), CRE prices declined approximately 11% from August 2022 through December 2023, a value erosion that pushed LTV ratios toward covenant ceilings long before DSCR tests flagged an income problem.
The formal trigger is the last signal. A loan whose DSCR tests at 1.24x in Q1 against a 1.25x covenant minimum was at 1.31x in Q3, 1.28x in Q4, and 1.26x in Q1 of the prior year. Each of those readings told a story.
None of them generated an alert because all three were technically above the threshold. The lender learned about the problem when the Q1 test missed by one basis point, and the covenant was breached.
That is the gap that real estate portfolio monitoring frameworks need to close: surfacing the directional signal – the declining trend.

Most lenders maintain a watch list: a designated tier of loans under closer review after a covenant breach or a defined credit trigger. The pre-watch list is the tier before that: loans that have not tripped a formal trigger but are showing directional movement that warrants closer attention. This is where the leverage actually lives.
A borrower on the pre-watch list still has options: they can source equity, restructure a lease, negotiate modified terms from a position that is not yet adversarial. A borrower on the formal watch list is already negotiating against a triggered default. The lender's position in both conversations is different, and so is the cost of the resolution.
Building a pre-watch list requires a different set of signals than covenant testing provides. According to CREFC MarketMetrics, bank-held CRE delinquency ran at approximately 1.82% in Q1 2025, but the office sector alone ran at 11.0% delinquency at large banks as of Q2 2024, per the Federal Reserve Supervision and Regulation Report, November 2024.
That dispersion tells you that portfolio-average metrics miss the sector-level concentrations where pre-watch signals actually cluster. Effective ways to monitor covenant compliance across a CRE loan portfolio start with knowing which signals move first at the tenant, property, and market level.
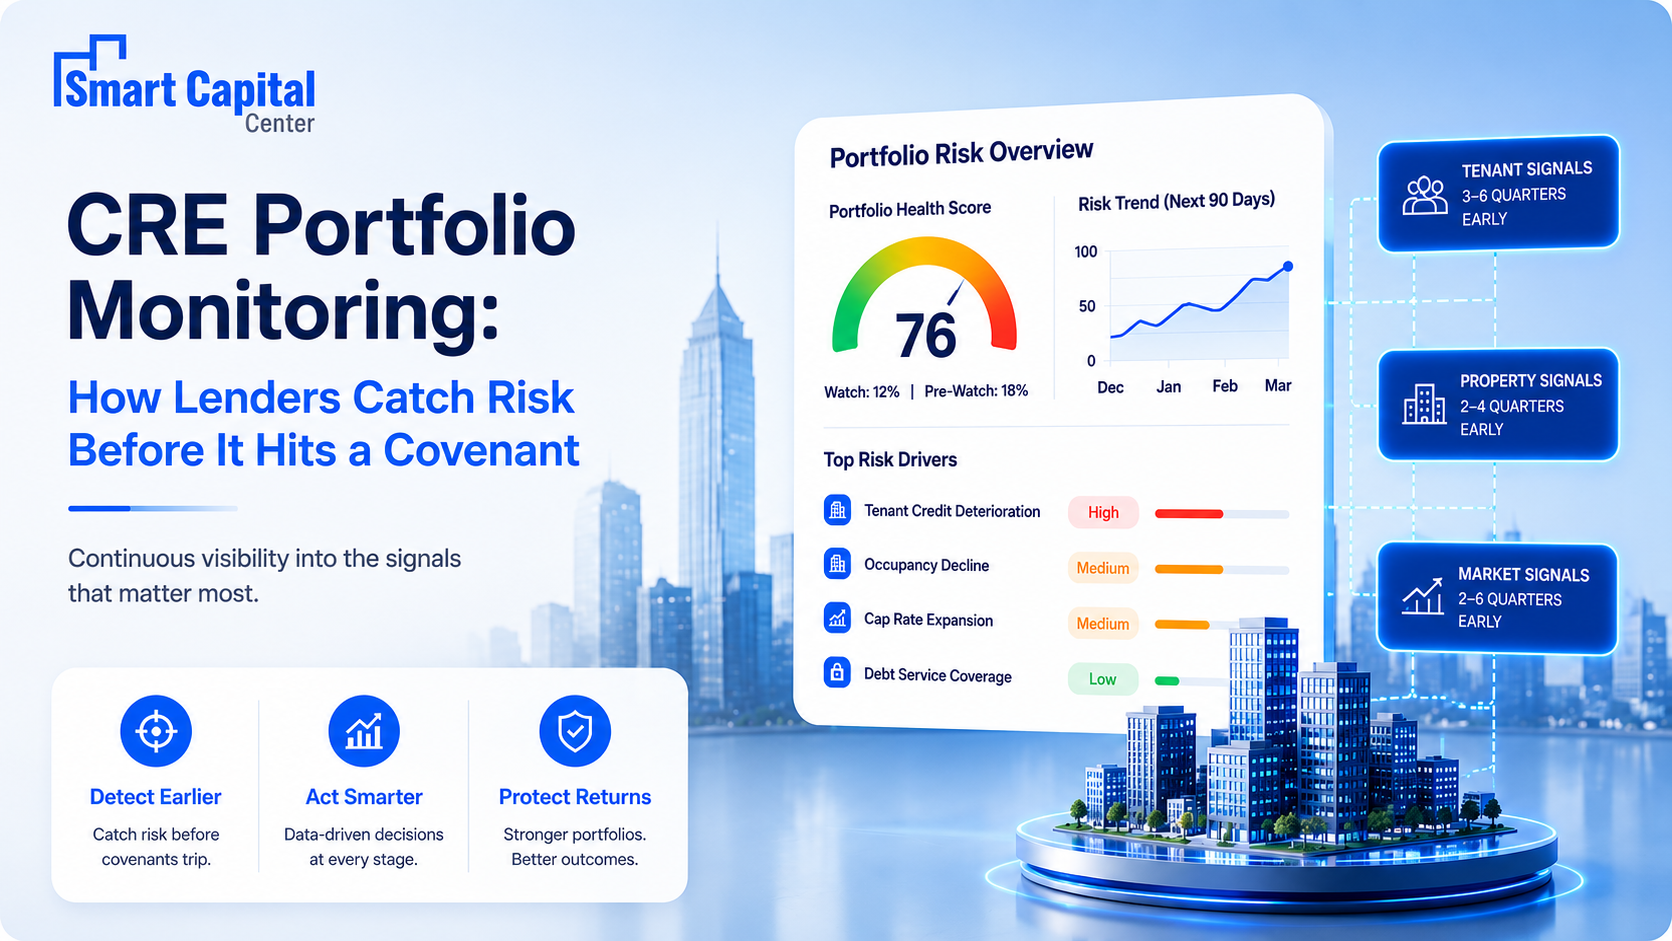
The signals that predict a covenant breach arrive in three layers: tenant, property, and market. Each operates on a different timeline, and the earliest signals are almost always at the tenant level.
| Signal Layer | Early Warning Indicators | Time Before Covenant Breach | How to Monitor |
|---|---|---|---|
| Tenant | Negative news, store closure announcements, credit rating actions, sentiment decline, sublease listings | 3–6 quarters | Continuous news monitoring; sentiment aggregation per tenant |
| Property | Occupancy drift vs. prior period, expense ratio increase, deferred capex accumulation, listing data vs. stated occupancy | 2–4 quarters | Monthly financial statement extraction; live listing cross-check |
| Market | Cap rate expansion in submarket, comp-set value decline, absorption slowdown, rent comp divergence from underwriting | 2–6 quarters | Real-time market signal benchmarking against origination assumptions |
| Covenant | DSCR approaching threshold, LTV above 70%, DSCR test dates, reporting delinquency | 0–1 quarter | Standard covenant tracking against loan agreement terms |
As of December 2025, the overall CMBS delinquency rate stood at roughly 7.1%, rising to about 8.75% once performing matured balloons are included, according to Trepp’s CMBS Delinquency Report November 2025 – a gap that early portfolio monitoring is designed to catch.
The most commonly missed layer is the tenant. A national retail tenant announcing 200 store closures is public information on the day it breaks. For a lender with three loans on properties anchored by that tenant, the signal is material and time-sensitive.
Manual review workflows will catch it when the next quarterly report arrives. Continuous monitoring catches it the day it happens.
Tenant monitoring is the most asymmetric opportunity in CRE portfolio monitoring because it provides maximum lead time at minimum analytical cost. Smart Capital Center runs continuous deep research on every tenant across every property in the portfolio simultaneously, monitoring negative news, expansion or contraction signals, credit deterioration, and public sentiment. When a tenant with significant income exposure has a material event, an alert surfaces with a clickable source citation and the specific properties and income amounts affected.
Cross-property tenant concentration is the specific risk that single-asset monitoring consistently misses. A tenant representing 9% of NOI at one property looks manageable. The same tenant at four properties represents 36% of total portfolio income – a concentration that only appears in a portfolio-level view. Smart Capital Center surfaces this in absolute income terms, so the concentration is visible before the first property shows stress in its financial statements.
The standard quarterly financial statement review tells you what happened. Between reporting cycles, three property-level signals move before the financials update: listing data versus stated occupancy (a property whose rent roll shows 91% occupied but has three active vacancy listings on commercial platforms is presenting inconsistent data that warrants a check)
Expense ratio drift (a property whose operating expenses have increased 12% year-over-year in a flat-rent environment is absorbing margin that will show up in DSCR eventually) and deferred capex (a property whose capital reserve draw history has dropped to zero for three quarters while the inspection report shows deferred maintenance is accumulating risk off the financial statements).
Smart Capital Center cross-references extracted financial data against live listing information and prior-period actuals automatically, flagging discrepancies between stated and observable conditions for analyst review.
A loan underwritten at a 5.25% cap rate in a submarket that has repriced to 6.0% carries an LTV that has increased without any change in the property’s financials. That is the collateral-level signal that most portfolio risk monitoring programs miss because they are tracking what the borrower reports. Smart Capital Center benchmarks origination-era assumptions against 1B+ real-time market signals across 120M+ properties, continuously flagging when a property’s submarket has repriced materially from the cap rate, rent, or vacancy assumption embedded at origination.

A borrower’s largest tenant, representing 22% of the property’s income, files for Chapter 11 protection on a Tuesday morning. The lease is not in default yet; the filing is the signal. A lender monitoring through quarterly reports learns about this at the next scheduled review, six to eleven weeks later. By then, the borrower has already been in crisis mode, and the lender’s options have narrowed to reactive responses.
Smart Capital Center mitigates this through continuous negative news monitoring that triggers automatic alerts on bankruptcy filings, restructurings, and closure announcements for tenants with portfolio income exposure, with every alert backed by a clickable source citation and the specific properties and income amounts affected identified.
A lender reviewing individual loan files sees a 9% tenant concentration at each of four properties. Nothing in any single file triggers a watch-list threshold. The portfolio-level exposure is 36% to a single tenant in a sector under pressure. No analyst running quarterly reviews on individual loan files will assemble that picture unless they specifically build a portfolio-aggregation step into their process.
Smart Capital Center mitigates this through portfolio-wide tenant mapping that surfaces total income exposure by tenant in absolute terms across all properties simultaneously, with natural-language querying that allows analysts to ask “Which loans have more than 10% NOI exposure to this tenant?” and receive a ranked answer across the full portfolio in seconds.
A multifamily loan underwritten at 72% LTV in 2021 used a cap rate assumption of 4.75%. The submarket has repriced to 5.75% over three years. With the same NOI, the implied value has declined approximately 17%. The loan’s LTV is now closer to 87%, well above the 80% covenant threshold, and no one knows it because the last formal appraisal is 26 months old and the covenant test relies on the borrower’s certified value.
Smart Capital Center mitigates this through real-time market signal benchmarking that continuously compares origination-era cap rate, rent, and vacancy assumptions against current submarket data, flagging when the implied LTV has moved materially from the origination value before the formal covenant test date.
CRE Portfolio Monitoring: Signal Layers That Catch Risk Before the Covenant
| Signal Layer | Early Warning Indicators | Time Before Covenant Breach | How to Monitor | Source (linked) |
|---|---|---|---|---|
| Tenant |
Negative news: store closures, bankruptcy filings, credit rating actions Expansion contraction: workforce reductions, sublease listings Sentiment decline across public review channels |
3–6 quarters before breach |
Continuous news monitoring Sentiment aggregation per tenant Cross-property NOI exposure mapping |
Trepp, Q4 2024 CRE Loan Performance Report |
| Property |
Occupancy drift vs. prior period (rent roll vs. live listing data) Expense ratio increasing year-over-year in flat-rent environment Deferred capex accumulation (zero reserve draws + inspection flags) |
2–4 quarters before breach |
Monthly financial statement extraction Live listing cross-check vs. stated occupancy Cross-document expense benchmarking |
CBRE, 2025 U.S. Real Estate Market Outlook |
| Market |
Cap rate expansion in submarket vs. origination assumption Rent comp divergence from underwriting model Absorption slowdown; active vacancy listings exceed rent roll |
2–6 quarters before breach |
Continuous benchmarking vs. 1B+ live market signals Origination-era assumption vs. current transaction data Submarket-level comp-set analysis |
Smart Capital Center, deployment data, 2024 |
| Cross-Portfolio Tenant Concentration |
Single tenant >8% NOI at one property = manageable Same tenant >8% NOI across 4 properties = 32% concentration risk Sector-level exposure clustering (e.g., retail or office) |
Invisible until portfolio-level view |
Portfolio-level tenant mapping in absolute NOI terms Natural-language query: 'Which loans have >5% NOI exposure to this tenant?' Cross-property aggregation — not available in single-asset review |
Smart Capital Center, portfolio monitoring data, 2026 |
| Covenant (DSCR Trend) |
DSCR directional decline across 2–3 consecutive quarters Cushion narrowing: 1.28x → 1.26x → 1.24x on 1.25x minimum LTV approaching threshold before formal appraisal refresh |
0–1 quarter — lagging indicator |
Directional trend monitoring (not binary pass/fail) Alert when cushion narrows below configurable threshold Continuous testing as new financials arrive — not on cycle |
FDIC Risk Management Manual; OCC CRE Lending Handbook |
1. Step 1: Define your pre-watch signal thresholds before any loan enters the portfolio. Establish the specific values that trigger analyst attention at each layer: a DSCR cushion below 15%, a tenant representing over 8% of portfolio NOI with a negative news alert, an occupancy discrepancy between the rent roll and live listing data of more than 3 percentage points. These thresholds are the monitoring framework. Smart Capital Center configures alerts against them continuously.
2. Step 2: Map every tenant across every property and calculate their total portfolio income exposure. Before any monitoring framework is operational, establish the baseline: which tenants appear across multiple properties, what percentage of total portfolio NOI each represents in aggregate, and which sectors carry concentration risk. Smart Capital Center delivers this view instantly in natural language.
3. Step 3: Connect monitoring alerts to analyst tasks with a defined response protocol. An alert is only useful if it produces an action. Define what each alert type triggers: a tenant news alert on a 10%+ NOI tenant goes to the senior credit officer within 24 hours; an occupancy discrepancy flag goes to the asset manager responsible for that loan for verification within 5 business days. Smart Capital Center routes alerts to the assigned team member with the loan record and source citation attached.
4. Step 4: Run a quarterly natural-language portfolio query before every formal review cycle. Before assembling the quarterly report, query the portfolio in plain language: “Which loans have a DSCR cushion below 10%?” “Which properties show occupancy below the origination assumption?” “Which tenants with more than 5% NOI exposure have had negative news in the last 90 days?” Smart Capital Center answers all of these across the full portfolio in seconds, giving the review cycle a prioritized agenda.
A covenant trip is a confirmation that deterioration already happened. The lenders with the best workout outcomes are those whose monitoring frameworks surfaced the tenant signal, the occupancy drift, or the market repricing weeks before the formal trigger, when the borrower still had options and the conversation could still be productive.
Smart Capital Center’s continuous CRE portfolio monitoring layer monitors every tenant, every property, and every market signal simultaneously, surfaces cross-property concentration risk in absolute income terms, and answers portfolio-level questions in natural language across 1B+ real-time signals spanning 120M+ properties, the same infrastructure used by clients, including KeyBank and Rose Community Capital.
Catch covenant stress weeks before formal breach and see cross-property tenant concentration in one view before it becomes a credit problem. Book a demo with Smart Capital Center.
The most reliable approach is to monitor signals that move before financial statements update: tenant news, live listing data versus stated occupancy, market repricing relative to origination assumptions, and directional DSCR trends. A covenant breach is typically preceded by two to six quarters of observable signals at the tenant, property, or market level. CRE portfolio monitoring frameworks that operate on these signals continuously catch the directional story before the trigger event. Smart Capital Center monitors all three signal layers simultaneously across the full portfolio.
The challenge with individual loan file review is that concentration risk is invisible at the property level by definition. It only appears when you aggregate across properties. Smart Capital Center’s portfolio risk monitoring layer surfaces total income exposure by tenant across all properties simultaneously, in absolute NOI terms.
Annual or quarterly financial statement review is standard, but it creates a monitoring gap that is largest precisely when conditions are changing fastest. A 2025 Federal Reserve working paper found that banks relying on borrower-reported performance data are slower to update risk ratings as information becomes stale, and that borrowers with stale financials are more likely to default.
The practical answer is to supplement periodic financial reviews with continuous monitoring of signals that do not depend on borrower submissions: live listing data, tenant news, and market repricing. Smart Capital Center monitors all of these continuously so the quarterly financial review starts from a pre-screened loan list.
A pre-watch list works when the signal thresholds are defined in advance and the alerts are automatic. Define the specific values that trigger closer attention: DSCR cushion below 15%, a tenant representing over 8% of portfolio NOI with a negative news alert, an occupancy discrepancy between the rent roll and listing data, and configure the monitoring system to surface those loans automatically.
Smart Capital Center generates these alerts with source citations attached, so the pre-watch designation is driven by the system. The real estate portfolio monitoring process then focuses analyst attention on the flagged loans.
Most lenders rely on borrower-certified values or the most recent formal appraisal for LTV covenant testing. In a market where cap rates have moved 75–125 basis points from origination, that reliance systematically understates current LTV. The check is straightforward: compare the origination cap rate assumption against the current transaction-validated cap rate in the specific submarket and asset class, apply the current rate to the property’s trailing NOI, and calculate the implied value.
Smart Capital Center automates this calculation across the full portfolio using 1B+ real-time market signals, flagging loans where the implied LTV has moved materially from the origination value before the formal appraisal cycle produces a certified number.
Asset managers consistently report that manual CRE portfolio monitoring can sustain perhaps a dozen loans at meaningful depth before the process becomes triage. Beyond that threshold, monitoring defaults to the most visible loans. Smart Capital Center addresses this directly: by automating the signal detection layer, analyst attention concentrates on the loans the system has already flagged. The same team can monitor 200 loans with consistent depth because the system handles the continuous signal detection, and the analyst handles the judgment call when something warrants action.