


AI in Commercial Real Estate

September 14, 2026
AI in Commercial Real Estate
September 14, 2026
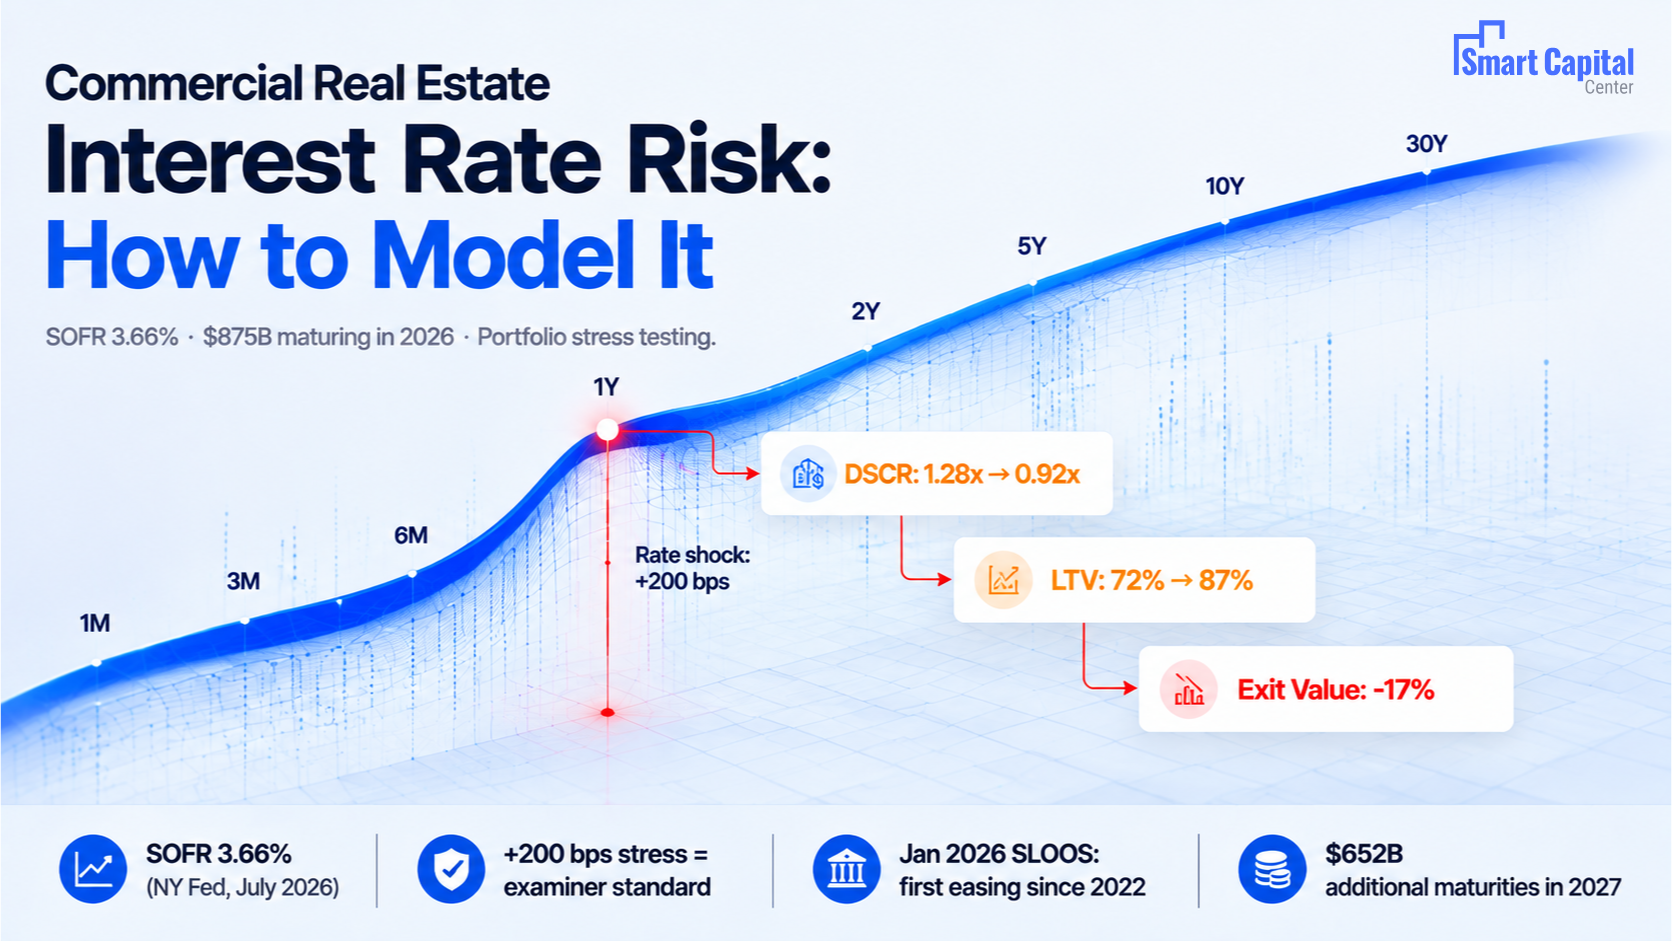
For CRE lenders and investors, interest rate risk is the single exposure that touches every deal in the portfolio at once. Smart Capital Center gives underwriting and portfolio teams continuous rate benchmarking and portfolio-level stress testing across 1B+ real-time market signals, so a rate move that changes DSCR on 200 loans is quantified in minutes, not weeks. The Federal Reserve's January 2026 Senior Loan Officer Opinion Survey marked the first meaningful easing of CRE lending standards since 2022, but easing standards do not eliminate rate risk, they change its shape, and the teams that can model that shape in real time are the ones setting terms instead of reacting to them.
SOFR: the benchmark replacing LIBOR for most CRE floating-rate loan pricing. As of July 31, 2026: 3.66% (NY Fed). Most stabilized CRE loans price at SOFR + 200–275 bps; bridge loans at SOFR + 300–400 bps.
Rate cap: derivative limiting how high a floating rate can rise, in exchange for an upfront premium (typically 1–3% of notional). Required by most bridge lenders.
Interest rate swap: exchanges floating-rate payments for fixed-rate payments over a defined period. Eliminates volatility but creates breakage cost if rates fall.
DSCR sensitivity: the change in debt service coverage ratio under different interest rate scenarios. The core metric for interest rate impact on CRE at the loan level.
Refinance risk: the risk that a maturing loan cannot be refinanced at the required proceeds due to rate movement, valuation change, or lender capacity constraints.
Rate shock: a defined stress scenario (typically +100, +200, or +300 bps) applied to measure portfolio interest rate exposure. Required by OCC and FDIC examiners for portfolios with floating-rate concentration.
As of August 2026, the average commercial real estate loan interest rate ranges from approximately 5.70% (agency multifamily) to 6.63% (CMBS), with the 10-year Treasury at ~4.30%, down ~25 bps from its February 2026 peak. SOFR sits at 3.66%. A borrower who originated a floating-rate loan at SOFR + 270 bps in 2021 (effective coupon ~2.75%) now faces a refinancing coupon of ~6.36% at the same spread – a 3.61% coupon increase on the same loan before any property-level change. That is the rate gap driving 2026 maturity stress.
“$875 billion in scheduled maturities in 2026 and $652 billion in 2027 will fuel additional lending activity.” – Mike Fratantoni, Chief Economist, MBA (2026 CREF Convention)
For an in-depth cap rate and lending environment context, see 2026 CRE Outlook.

Illustrative: $8M loan, 30-year amortization, 1.25x DSCR covenant minimum. Red = breach. Amber = warning zone.
1. Establish the base case from current market rates. Build base DSCR using today’s refinancing rate at current leverage. The gap from the origination-era DSCR is your baseline rate exposure before any shock is applied.
2. Apply +100, +200, and +300 bps rate stress scenarios above the base case. For floating-rate loans, apply to current SOFR + spread. Flag any scenario producing DSCR below the covenant minimum and document the output for examiner review.
3. Run simultaneous income stress alongside each rate scenario. Model NOI at -5%, -10%, and -15% alongside each rate shock. The double-stress scenario (rate up + income down) is the OCC/FDIC standard for CRE rate risk documentation.
4. Calculate the equity gap at each breach scenario. Divide the stressed debt service by 1.25x to find the required NOI; capitalize the shortfall at the market cap rate to produce the equity the borrower must fill to refinance at par.
5. Aggregate deal-level sensitivity into a portfolio exposure view. Smart Capital Center runs +100, +200, and +300 bps stress across the full portfolio simultaneously, segmented by property type, submarket, and vintage.

The most common refinance risk driver in 2026 is the commercial real estate loan interest rate gap. At 30-year amortization, a 3.61% coupon increase adds approximately $270,000 in annual debt service per $5M of loan balance. If current NOI no longer covers required debt service at the refinancing rate, the gap between the loan balance and what a lender will extend at 1.25x DSCR is the equity the borrower must contribute or the principal reduction the lender must accept. Smart Capital Center benchmarks origination-era rate and cap rate assumptions against current market data in real time.
A 100 bps cap rate expansion from 4.75% to 5.75% on an asset with $500,000 NOI reduces indicated value from $10.5M to $8.7M – a 17% decline with no change in income. Cap rate modeling requires three current inputs: origination-era exit cap assumption; current transaction-validated cap rate for the specific submarket and asset class (prior-90-day window); and the forward cap rate assumption for the expected exit date. Smart Capital Center benchmarks exit cap rate assumptions against 1B+ live market signals.
The most consequential hedging decision in 2026 is rate cap renewal on expiring bridge loans. Renewing a 2022 cap at a 3.50% strike costs significantly more in 2026 – the option is closer to the money at current SOFR. Those renewal premiums reduce distributable cash flow and were not in the original underwriting model.
The aggregate question is: at +100 bps, what percentage of the portfolio breaches 1.20x DSCR? At +200 bps? At +300 bps? Which property types and submarkets carry the most concentrated exposure? McKinsey QuantumBlack’s 2025 State of AI Survey (Alex Singla, Alexander Sukharevsky, Lareina Yee, Michael Chui) found that “full scaling will require redesigning workflows around AI capabilities, and establishing the operating discipline to make those workflows reliable.” Portfolio-level rate stress testing is precisely that workflow: Smart Capital Center runs all three stress scenarios across the full portfolio in minutes, aggregated by property type, submarket, and vintage, replacing the multi-day Excel assembly most teams currently run between reporting cycles.
The OCC’s Fall 2025 Semiannual Risk Perspective (December 2025) identified CRE refinancing risk as requiring ongoing monitoring. Examiners expect: a documented rate shock methodology (+100, +200, +300 bps); DSCR outputs at each scenario for the full portfolio; a defined threshold below which loans enter enhanced monitoring; and evidence that stress testing runs on a defined cadence. Smart Capital Center’s portfolio stress outputs are source-linked and timestamped, producing an exportable examiner-ready file without manual reconstruction.

The firms entering the 2026 maturity cycle with the clearest view of their rate exposure are those who have already run the +100, +200, and +300 bps stress across the full portfolio, identified the breach cohort, and calculated the equity gap for each loan in that cohort. Smart Capital Center’s continuous benchmarking against current SOFR levels, Treasury movement, and transaction-validated cap rates means portfolio rate exposure is observed in real time.
Run a +100, +200, and +300 bps rate stress across your full portfolio before the next reporting cycle. Book a demo with Smart Capital Center.
Calculate annual debt service at the stressed rate (base + shock, same amortization); divide current NOI by stressed debt service. Apply +100, +200, and +300 bps above the current rate. Also model simultaneous income stress (-5%, -10%, -15% NOI) alongside each rate scenario. This double-stress combination is the OCC/FDIC standard for commercial real estate loan interest rate risk documentation.
Standard modeling interest rate risk in CRE financing applies three scenarios: +100 bps (moderate), +200 bps (significant), and +300 bps (severe). OCC and FDIC examiners expect all three documented with DSCR outputs and the percentage of portfolio balance breaching the 1.20x or 1.25x covenant minimum under each. For floating-rate loans, apply to SOFR + spread; for fixed-rate loans at maturity, apply to the refinancing rate assumption.
Most floating-rate CRE loans reset monthly or quarterly at SOFR + credit spread. A 100 bps SOFR increase adds ~$100,000 in annual debt service on a $10M loan. SOFR as of July 31, 2026 was 3.66% (NY Fed), versus near-zero in 2021. Bridge and value-add loans originated in 2021–2022 at SOFR + 300–400 bps now carry effective coupons of 6.66–8.66%.
A rate cap limits how high a floating rate can rise in exchange for an upfront premium, while the borrower retains the benefit if rates fall. A swap exchanges floating for fixed, eliminating volatility but also eliminating the benefit of rate decreases and creating breakage cost exposure. Rate caps suit short-term bridge strategies; swaps suit longer-term stabilized loans seeking predictable cash flow.
Four steps: (1) Calculate annual debt service at the current refinancing rate. (2) Divide by 1.25 to find the NOI required for covenant compliance. (3) Compare against trailing T-12 NOI. (4) If actual NOI falls short, capitalize the shortfall at the market cap rate. That is the equity gap the borrower must fill or the lender must absorb as principal reduction.
Rising commercial real estate interest rates put upward pressure on cap rates, compressing exit valuations even when NOI is unchanged. A 100 bps cap rate expansion from 4.75% to 5.75% on a $500,000 NOI property reduces indicated value from $10.5M to $8.7M, a 17% decline. This cap rate effect means interest rate risk must be modeled at the asset value level: it can breach LTV covenants on loans that remain current on payments.