


CRE Investors

August 12, 2026
CRE Investors
August 12, 2026

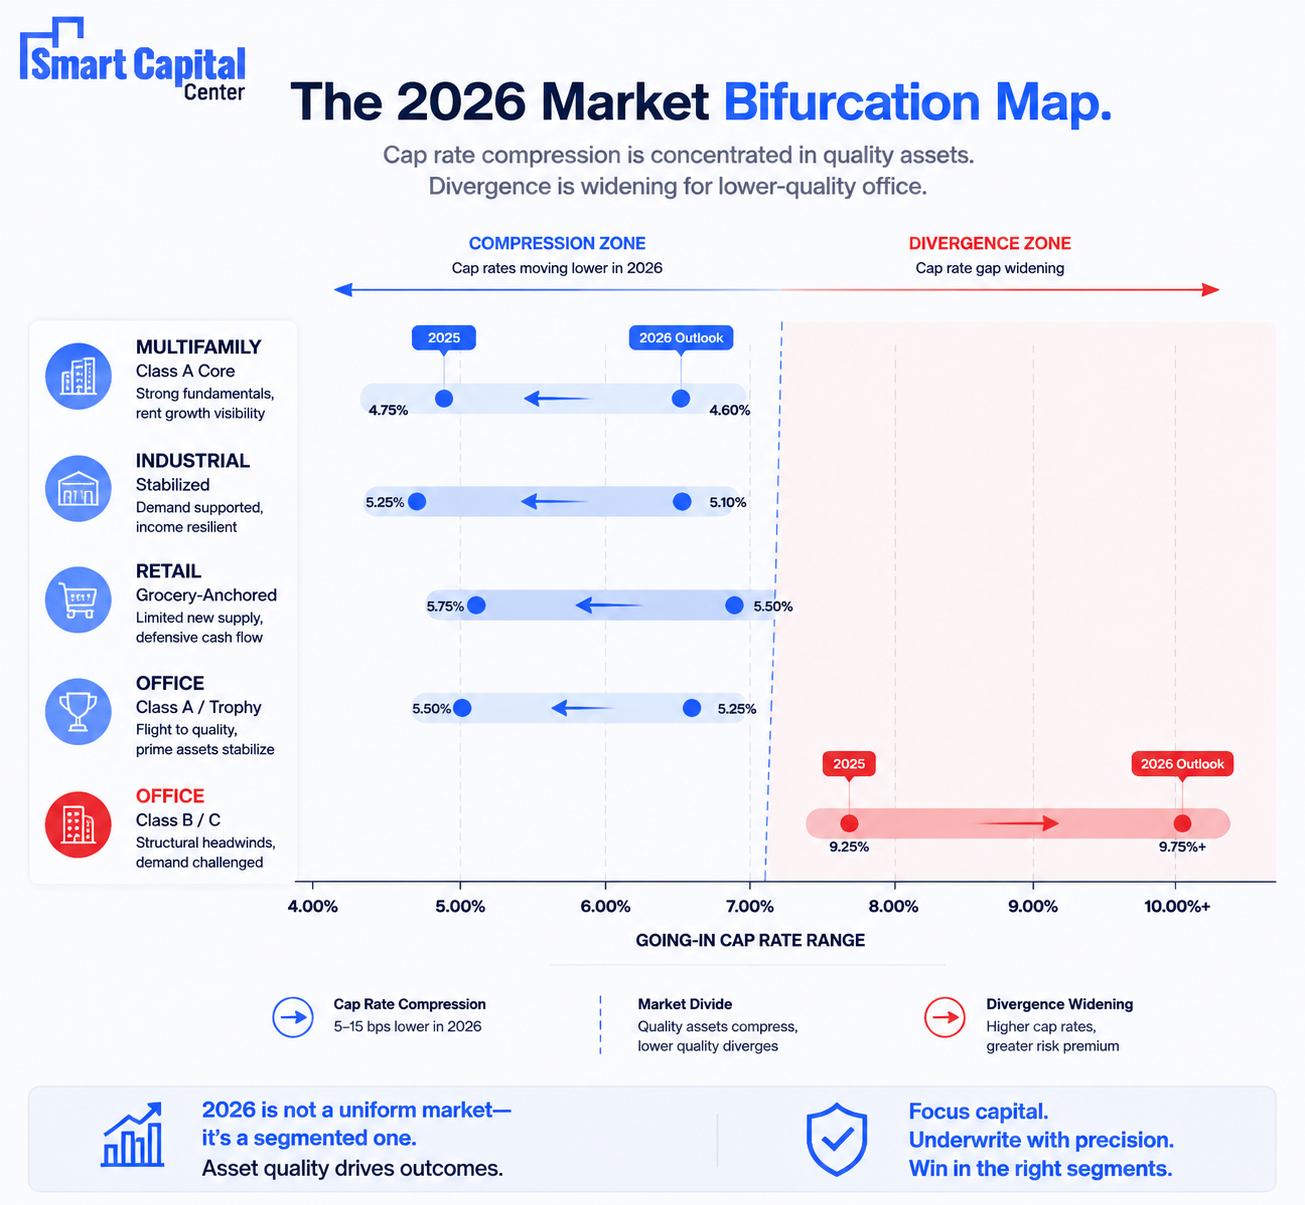
According to CBRE’s 2026 U.S. Real Estate Market Outlook, Capital Markets, cap rates for most property types are expected to decrease 5–15 basis points in 2026, with higher-quality assets positioned for greater compression, and CBRE executed the most confidentiality agreements with prospective property buyers since 2022. The 2026 commercial real estate outlook is a bifurcated market in which asset quality, capital structure, and assumption precision determine outcomes more than broad market direction.
This analysis draws on Smart Capital Center, a CRE AI platform monitoring 1B+ real-time market signals across 120M+ properties, used by JLL, KeyBank, and leading institutional lenders and investors, to map the market conditions shaping the CRE 2026 outlook and identify which underwriting assumptions require the most urgent revalidation.

The CRE outlook for cap rates in 2026 is more nuanced than cycle-level summaries suggest. CBRE Econometric Advisors’ H2 2025 Cap Rate Survey, drawing on 3,600 cap rate estimates across more than 50 U.S. markets from over 200 CBRE professionals, documented that “U.S. cap rates showed signs of renewed stability in the second half of 2025 as volatility eased and investor sentiment strengthened.” The survey also noted that the spread between lower and upper office yield estimates stopped widening for the first time since 2022, signaling early stabilization even in the most challenged sector.
What the data shows is a market segmented by asset class and quality tier rather than moving uniformly:
• Industrial and multifamily: Positioned for modest cap rate compression in 2026. CBRE Research (Q2 2025) documented the average core multifamily going-in cap rate falling 6 basis points to 4.75%, with rent growth assumptions of 2.8%–3.3% for core and value-add assets respectively. Industrial faces some softening from supply absorption but remains the most competitively bid asset class for institutional capital.
• Office: Bifurcation defines the sector. Prime Class A properties are stabilizing with investor interest broadening from trophy assets. Class B and C properties carry cap rates in the double digits in many markets – a spread that reflects genuine differences in risk and income growth prospects.
• Retail: CBRE notes that risk-adjusted returns look particularly attractive in well-located grocery-anchored and open-air centers. The sector has worked through most of its structural repricing and is benefiting from limited new supply.
The critical distinction for underwriting is that 2026 CRE outlook compression is concentrated in quality assets. The 5–15 basis point compression CBRE forecasts for most property types is front-loaded toward assets that can demonstrate rent growth and income predictability.
The most-watched data series for the commercial real estate outlook on the lending side is the Federal Reserve’s Senior Loan Officer Opinion Survey (SLOOS). The pattern through 2025 and into 2026 tells a specific story: three years of progressive tightening are giving way to stability, with early signs of easing in select categories.
The April 2026 SLOOS, covering Q1 2026, reported that banks kept CRE lending standards "basically unchanged", with stronger or basically unchanged demand across CRE loan categories. Critically, the January 2026 SLOOS’ special questions documented that banks expected CRE loan quality to improve over 2026, a significant shift from the deterioration expectations that characterized 2023 and 2024. Among banks that eased standards or terms on C&I loans in Q1 2026, major net shares cited “more aggressive competition from other banks or nonbank lenders” as the primary driver – the private credit market’s growth is forcing bank pricing discipline to return.
What this means in practice: the credit window is not wide open, but it is no longer closing. Relationship lenders with flexible structures are competing directly with debt funds for the same borrowers. Pricing pressure is coming from the private credit side, and bank spreads are narrowing for well-qualified sponsors with quality assets.

The MBA’s 2025 Commercial Real Estate Survey of Loan Maturity Volumes, released at the 2026 CREF Convention, documents $875 billion in commercial mortgage maturities scheduled for 2026, 17% of the $5 trillion outstanding, followed by $652 billion in 2027. MBA Chief Economist Mike Fratantoni stated at the convention that “$875 billion in scheduled maturities in 2026 and $652 billion in 2027 will fuel additional lending activity.” For lenders, that maturity volume is the primary source of new origination demand.
Private credit funds have expanded their role materially in this cycle. The Deloitte 2026 Commercial Real Estate Outlook, surveying 850+ C-suite executives across 13 countries, identified a “cautiously reawakening lender pool alongside deep private credit” as defining 2026’s capital environment. Competition between bank and non-bank lenders is compressing spreads for high-quality borrowers while leaving stressed assets and challenged sponsors with fewer options than the headline capital availability picture suggests.
The gap between assumptions locked in 12–24 months ago and current market conditions is not uniform across asset classes or submarkets, which is precisely why assumption-by-assumption revalidation matters more in this CRE market outlook than in a stable market environment. Four assumptions carry the highest revalidation priority:
Multifamily rent growth assumptions underwritten during 2021–2022 in Sun Belt and Mountain markets face significant gap risk. CBRE Research Q2 2025 documented asking rent growth assumptions of 2.8%–3.3% for core and value-add assets over the next three years, materially below what many legacy models assumed. Industrial rent growth assumptions in markets that absorbed significant new supply through 2023–2024 need similar recalibration.
An exit cap rate underwritten at 4.5% in 2021 in a market that transacted at 5.25%–5.75% through 2024 represents a disposition value gap that affects IRR projections throughout the hold period. CBRE’s 2026 forecast projects compression of 5–15 bps for most property types, which narrows the gap from peak divergence but does not close it to origination-era levels. Models carrying pre-2022 exit cap rate assumptions require explicit stress testing against the current range documented in CBRE’s H2 2025 survey.
National vacancy statistics mask submarket divergences that are material for underwriting. Office vacancy in Class A CBD product in gateway cities is converging toward 12–15%, while commodity suburban product runs at 20%+. Industrial vacancy in logistics corridors near major fulfillment infrastructure differs substantially from secondary markets with speculative supply. Assumption validation requires submarket-specific data.
A portfolio underwritten in 2021 at 4.5% exit cap assumptions on multifamily assets in supply-heavy Sun Belt markets is carrying a disposition value discrepancy that flows through every performance metric until a refinancing or sale forces reconciliation. The gap between origination assumptions and current transaction-validated cap rates in these markets can exceed 100 basis points, which is not a rounding error.
Smart Capital Center mitigates this through continuous market signal benchmarking that compares origination-era exit cap assumptions against current transaction-validated data by submarket and asset tier, flagging divergences before a refinancing discussion forces the issue onto the credit committee’s agenda.
A lender whose credit policy reflects the peak-tightening posture of Q3 2023, when net shares of banks tightening CRE standards reached multi-year highs, is operating more conservatively than current competition warrants, potentially losing quality deal flow to private credit funds pricing 25–50 bps tighter. Conversely, a lender whose origination volume targets were built on 2021 volume assumptions is chasing deals in a market where quality and selectivity drive 2026 returns.
Smart Capital Center mitigates this through real-time market intelligence across 1B+ signals that reflect current lending market conditions, allowing origination teams to price and structure with the current competitive context.
A multifamily acquisition underwritten at 4% rent growth using metro-level data in a Sun Belt market where submarket vacancy is 12% and 3,000 new units deliver in the next 18 months will not achieve that rent growth. The metro average conceals the submarket condition. The model looks correct because it used published data, but the data were the wrong unit of analysis.
Smart Capital Center mitigates this through submarket-specific rent comp benchmarking drawn from 120M+ properties and live lease execution data, comparing model assumptions against the specific submarket and vintage range of the subject asset rather than metro-level averages that mask local divergence.

1. Step 1: Pull your exit cap rate assumptions for every active model and compare against the H2 2025 CBRE Cap Rate Survey range for that specific property type, tier, and submarket. CBRE’s survey provides ranges by market, subtype, and quality tier – the comparison should be specific to the same cell. Any assumption more than 50 bps outside the current range warrants explicit documentation of the reasoning.
2. Step 2: Compare rent growth assumptions against CBRE’s Q2 2025 documented ranges by asset class (2.8%–3.3% for multifamily) and against live submarket lease execution data. Models built on 4–5% rent growth in supply-pressured submarkets need a specific, sourced justification or a revised assumption. Smart Capital Center benchmarks this comparison against transaction-level rent comps in the specific submarket automatically.
3. Step 3: Stress-test your DSCR projections at current SOFR + spread levels. The April 2026 SLOOS documents that lending spreads are compressing for quality borrowers but remain elevated for stressed assets. Every model should show DSCR at current financing rates as a baseline, with sensitivity to a 25 and 50 basis point rate increase.
4. Step 4: Query your active pipeline against current market signals before any IC submission. Before any deal goes to committee, run the rent growth, exit cap, and vacancy assumptions against Smart Capital Center’s live 1B+ market signals. The system flags divergences between model inputs and current transaction-validated data, with the specific comp set and source cited, so the committee sees where the analysis rests on convention and where it rests on current evidence.
The most consequential shift in the 2026 commercial real estate outlook is the speed at which market conditions are moving relative to the assumption frameworks most teams last updated 12 to 24 months ago.
Smart Capital Center’s continuous benchmarking against 1B+ real-time market signals means that every model assumption is compared against current transaction-level data as the market moves. In a CRE market outlook where the spread between quality and commodity assets is widening, and assumption precision drives returns, continuous validation is the operational capability that separates informed decisions from convention-based ones.
Validate your 2026 underwriting assumptions against live market data. Book a demo with Smart Capital Center.
According to CBRE’s 2026 U.S. Real Estate Market Outlook, cap rates for most property types are expected to decrease 5–15 basis points in 2026, with compression concentrated in higher-quality assets. Multifamily and industrial are positioned for the most active investor interest. Office remains bifurcated: Class A and trophy properties are stabilizing and attracting broader investor interest, while Class B and C properties carry cap rates in the double digits in many markets. Total returns in 2026 will largely be driven by income rather than appreciation, making asset selection and management more important than market timing.
The April 2026 Senior Loan Officer Opinion Survey, published May 4, 2026, reported that bank lending standards for CRE loans were "basically unchanged" in Q1 2026, with demand for CRE loans stronger or basically unchanged. The January 2026 SLOOS included special questions where banks reported expecting CRE loan quality to improve over 2026 – a meaningful shift from the deterioration expectations of prior years. Among banks reporting eased lending terms, the most frequently cited reason was competition from other banks and nonbank lenders, indicating that the private credit market’s growth is actively compressing spreads for quality borrowers.
The four highest-priority assumptions to revalidate are: exit cap rates (models from 2021–2022 may be 50–150 bps below current transaction-validated ranges); rent growth in Sun Belt and supply-heavy markets (CBRE Research documents 2.8–3.3% for multifamily vs. the 4–5% many legacy models assumed); submarket vacancy (metro averages conceal submarket divergences of 5–10 percentage points); and loan pricing (SOFR + spread levels have moved materially from 2020–2022 origination assumptions). Smart Capital Center benchmarks each of these against current transaction-level data continuously, flagging divergences before they reach the IC.
The answer requires a platform that monitors market conditions continuously. Smart Capital Center draws on 1B+ real-time market signals across 120M+ properties, comparing model inputs against live transaction-level data in the specific submarket and asset class of each deal. Every assumption variance is flagged with the specific comp set that generated it and a source citation, giving the analyst the data needed to either justify the assumption or update it before the deal advances.
Private credit funds have expanded materially in the 2024–2025 cycle and are now competing directly with bank lenders for quality CRE borrowers, often pricing 25–50 basis points tighter for well-qualified sponsors on well-located assets. The April 2026 SLOOS documented that banks citing eased lending terms most frequently attributed the easing to competition from other banks and nonbank lenders. For relationship lenders, the implication is that holding origination volume targets built on 2020–2022 assumptions requires rethinking deal sourcing strategy as private credit captures more of the quality deal flow that previously defaulted to bank relationships.
Start with CBRE Econometric Advisors’ H2 2025 Cap Rate Survey, which provides cap rate ranges by property type, quality tier, and market across 3,600 estimates from 200+ CBRE professionals surveyed in December 2025. For each active model, find the specific row in the survey that matches the subject property’s type, tier, and geographic market, and compare the model’s exit cap assumption against that range. Any assumption outside the range by more than 25 basis points requires either a documented justification or an updated assumption. Smart Capital Center automates this comparison continuously, benchmarking model exit cap assumptions against live transaction records in the specific submarket.
The MBA’s 2025 survey of commercial real estate loan maturity volumes documented $875 billion in maturities scheduled for 2026 and $652 billion for 2027. As MBA Chief Economist Mike Fratantoni stated at the 2026 CREF Convention, that maturity volume “will fuel additional lending activity.” For lenders, the maturity wall is the primary source of new origination demand in 2026, but not all maturities are equal opportunities. Quality assets with realistic exit strategies and borrowers able to recapitalize will refinance competitively. Stressed assets with legacy assumptions that no longer hold will require restructuring, extension, or special servicing. The CRE 2026 outlook is therefore as much about maturity triage capacity as it is about new origination standards.