

No items found.

Free CRE Tool

CRE Maximum Purchase Price Calculator: How to Value a Commercial Property From NOI and Cap Rate

Published August 12, 2026 · Updated August 12, 2026

The Smart Capital Center CRE Maximum Purchase Price Calculator returns a price range in seconds. This free commercial property value calculator takes a property's annual net operating income and your target cap rate and returns the price that delivers that return, using the direct capitalization method: Purchase Price = Annual NOI ÷ Cap Rate. Add the asking price and you also see the cap rate the seller is asking you to accept.

Why a range matters: according to NCREIF's Q1 2026 Property Index, appraisal-based cap rates across 12,996 institutional properties sat at 4.57%, while properties that actually sold traded at 5.27%. That is a 70 basis point gap inside a single index, and it is why a purchase price estimate works better as a range.

This article walks through how to use the tool and how to read the results.

What Does the CRE Maximum Purchase Price Calculator Do?
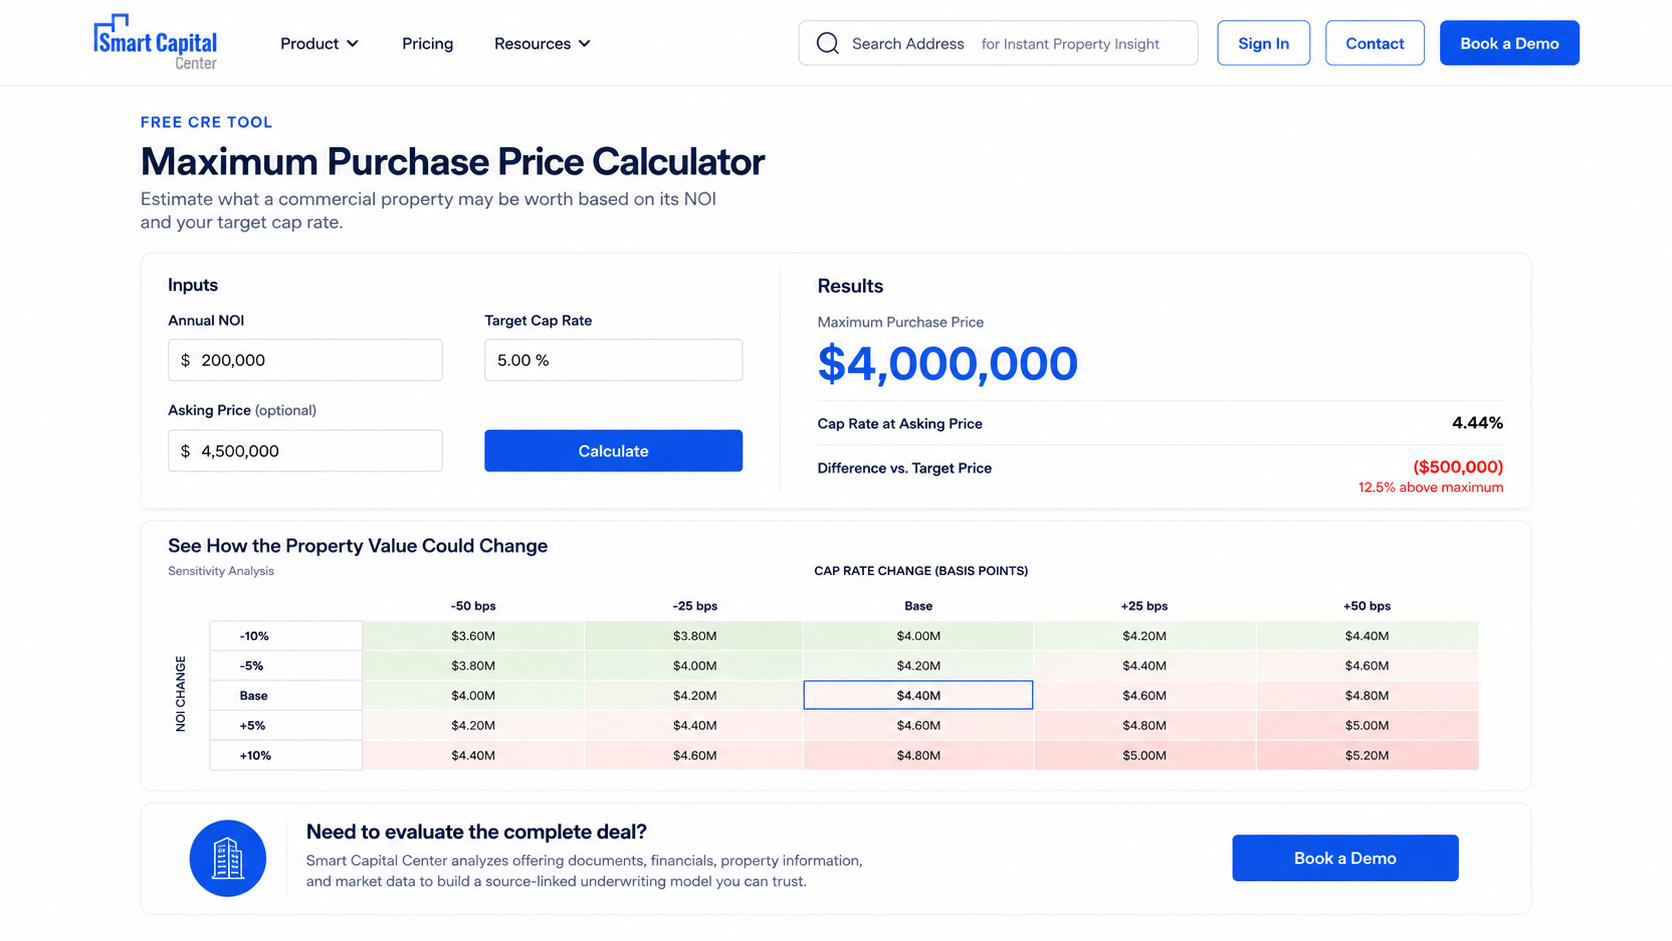
The CRE Maximum Purchase Price Calculator showing inputs, a $4,000,000 result, and the sensitivity table

The calculator uses the direct capitalization method, the standard first-pass valuation approach in commercial real estate. It is one of several methods covered in our guide to how to value a commercial property. The formula is one line:

Purchase Price = Annual NOI ÷ Cap Rate

Enter $200,000 of annual NOI at a 5.00% target cap rate. The result is $4,000,000.

Add an asking price of $4,500,000 and two more numbers appear:

OutputValueWhat it tells you
Maximum Purchase Price$4,000,000The price that delivers your 5.00% target
Cap Rate at Asking Price4.44%The return the seller's price actually produces
Difference vs. Maximum Price+$500,000How far the ask sits above your number

At $4,500,000, the seller wants you to accept 56 basis points less yield than your target. You now have a specific number to work with, and you have not opened a rent roll yet.

How to Use the Calculator: Three Steps
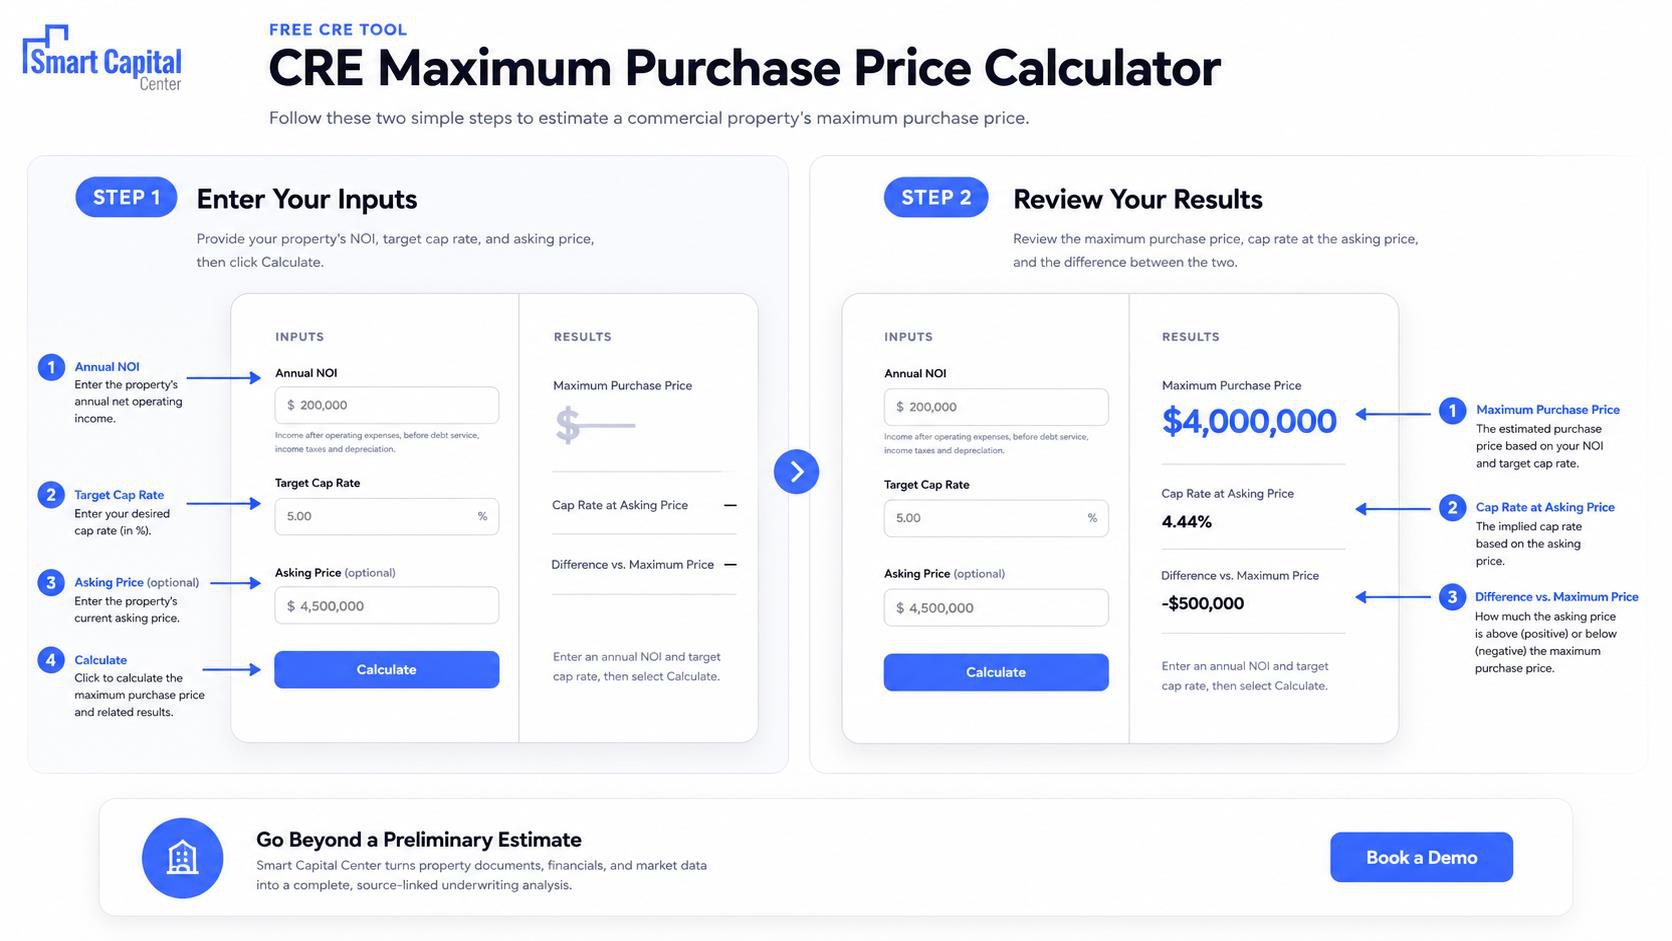
Two steps to use the calculator: enter your inputs, then review your results

Step 1. Enter the annual NOI

Use the property's net operating income for a full year. This is income after operating expenses and before debt service, income taxes, and depreciation.

Trailing twelve-month NOI is the safer starting point, because the seller can document it. If the offering memorandum gives you a pro forma figure, run that separately and compare the two answers. NOI is one of the five metrics that matter most when evaluating a commercial property.

Step 2. Enter your target cap rate

This is the unlevered annual return you require. Anchor it in recent comparable sales in the same submarket and asset class. Our complete guide to cap rates in commercial real estate covers how the metric behaves across property types.

If you are unsure of the right figure, enter your required return and let the sensitivity table do the rest.

Step 3. Add the asking price

This field is optional and worth using. Entering the asking price turns the tool from a valuation exercise into a negotiation exercise. You see the implied cap rate the seller expects you to accept, and the dollar gap between that expectation and your own number.

Select Calculate, then read the results panel and the sensitivity table underneath it.

How Do You Read the Sensitivity Table?
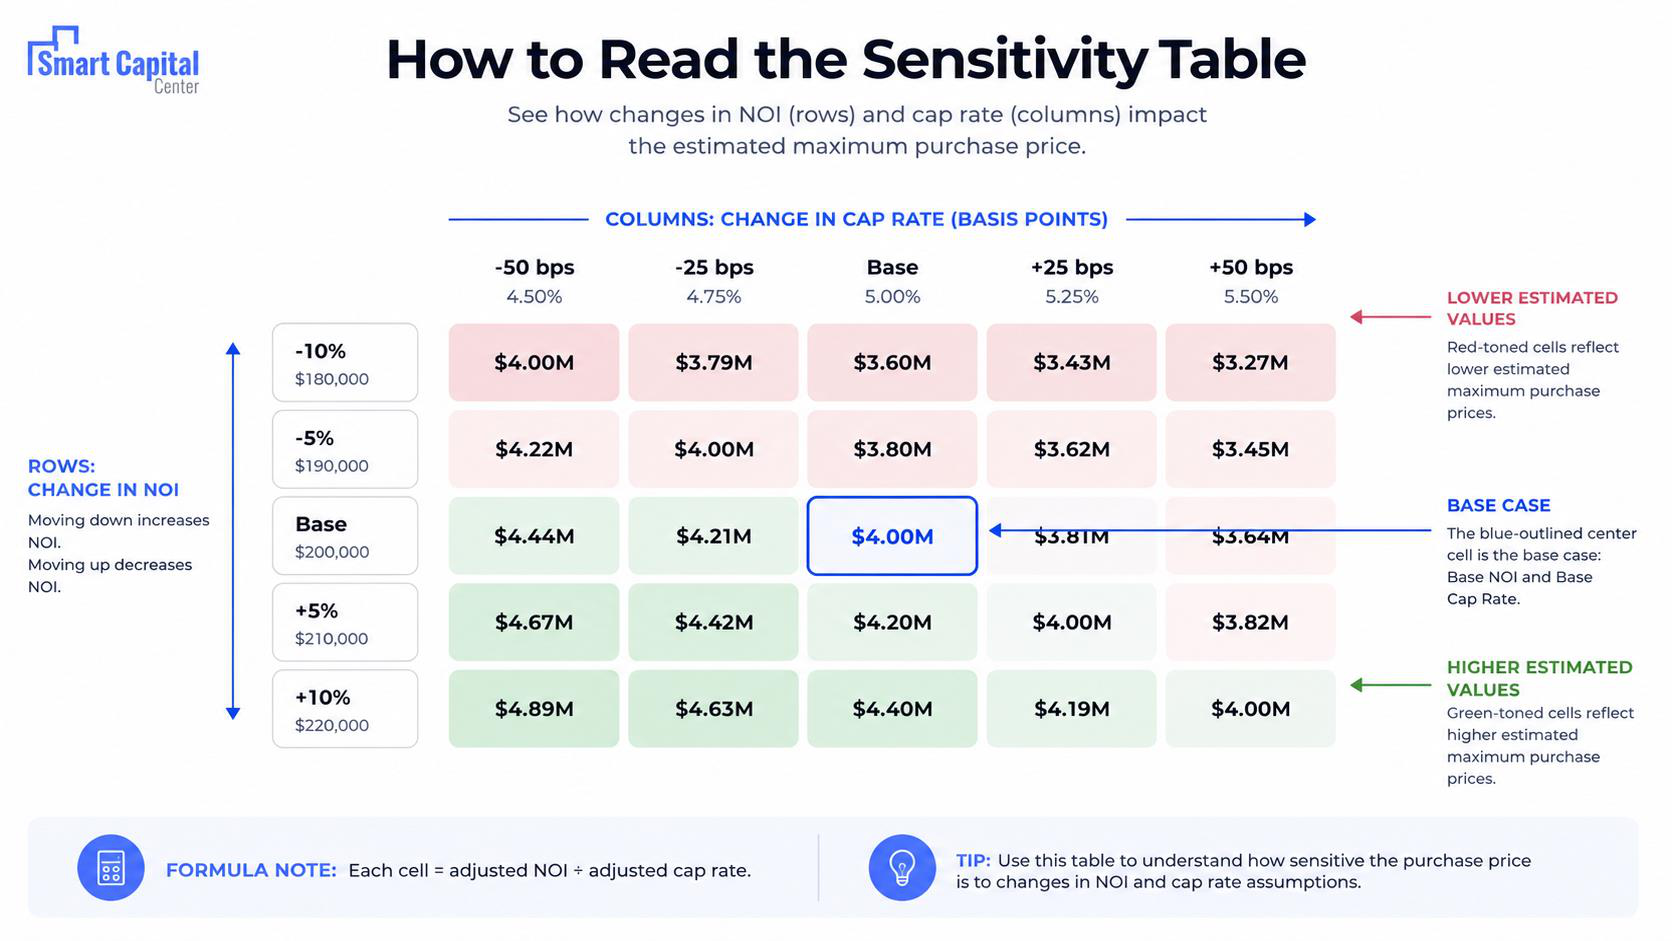
How to read the sensitivity table: NOI changes by row, cap rate changes by column, base case outlined in blue in the center

The sensitivity table shows 25 versions of the same deal. Rows move NOI up and down by 5% and 10%. Columns move the cap rate by 25 and 50 basis points in each direction. Every cell divides the adjusted NOI by the adjusted cap rate.

Green cells sit above your base estimate. Red cells sit below it. The blue-outlined cell in the center is the case you entered.

Read it in four passes.

1. Start with the diagonal

In the example, $4.00M appears five times along a diagonal band. Those are the combinations that cancel out. A 10% lift in NOI paired with 50 basis points of cap rate expansion lands in the same place as the base case.

This shows you how much cap rate movement your income growth can absorb.

2. Check the downside corner

The top right cell shows weak income and softer pricing at the same time. In the example that is $3.27M, about 18% below the base estimate.

If your equity cannot survive that outcome, you have learned something useful before spending money on diligence.

3. Measure the spread

The example runs from $3.27M to $4.89M. That is a $1.6M range on modest changes to two inputs.

A wide grid tells you the deal is sensitive to assumptions and needs tighter diligence on income durability.

4. Ask whether the range is realistic

The 25 and 50 basis point cap rate steps are not arbitrary. Real cap rate dispersion runs at least that wide.

The NCREIF gap cited above is the clearest example. Appraisal-based cap rates across its index sat at 4.57% in Q1 2026 while properties that traded came in at 5.27%. Both numbers describe the same market in the same quarter.

Writing for MSCI Research, Costello explains why the two figures drift apart. Resetting pricing assumptions after conditions change takes real work and is not a quick edit in a spreadsheet, while credit markets now reprice faster and more transparently than they did even a few years ago. The valuation on paper lags the price in the market.

Seventy basis points on $200,000 of NOI is the difference between a $4.38M value and a $3.80M value. Treat the full grid as the answer, not the center cell. For more on where current pricing is heading, see our 2026 CRE outlook on cap rates, lending, and investment.

Practical takeaway: if the deal only clears your return threshold in the green cells, your assumptions are doing more work than the property.

How Smart Capital Center Supports the Deeper Analysis

An acquisitions team reviewing a Smart Capital Center underwriting analysis on a laptop

Smart Capital Center turns property documents, financials, and market data into a complete underwriting analysis where every figure links back to its source. The platform draws on 1B+ real-time data points across 120M+ properties, with more than $500B in analyzed CRE transactions behind its benchmarks. It is SOC 2 certified.

For acquisitions and asset management teams, Smart Capital Center's AI delivers:

  • Underwriting built from source documents, with the rent roll, operating statements, and lease terms reconciled into one model
  • Market benchmarks for cap rates, rents, expenses, and sale comparables at the submarket level
  • Debt sizing and scenario testing across rate, proceeds, and covenant assumptions
  • Portfolio monitoring with real-time performance tracking and stress testing after close
  • Credit memos and investment summaries drafted in minutes from the underwriting data

Fernando Salazar, Director of Asset Management at JLL, reports a 30x productivity gain for his team using the platform. Ken Schroeder, SVP at KeyBank, reports a 40% reduction in financial model preparation time. More detail is in our client case studies.

How Wide Is the Cap Rate Range in Practice?

Cap rate dispersion is measurable, and every published source reports it as a range. The table below shows how far apart two credible estimates of the same market can sit, which is the practical case for testing a spread instead of a single input.

MeasureObserved spreadSource and period
Appraisal vs. transaction cap rates, all property70 bps (4.57% vs. 5.27%)NCREIF Property Index, Q1 2026
Lower vs. upper stabilized office cap rate estimateAbout 100 bps (survey example: 6% to 7%)CBRE U.S. Cap Rate Survey, H2 2025
Listed REIT implied vs. private appraisal cap ratesAbout 130 bps, down from about 240 bps in 2023McKinsey Global Private Markets Report, March 2026
Expected cap rate direction, next six monthsMost common answer was no change; nearly half of retail, industrial, and hotel respondents expect declinesCBRE U.S. Cap Rate Survey, H2 2025

The CBRE U.S. Cap Rate Survey published in February 2026 drew on 3,600 cap rate estimates across more than 50 U.S. markets, collected from more than 200 CBRE capital markets and valuation professionals. Every estimate in it is expressed as a lower and an upper bound. CBRE reports that the average spread between those bounds for office stopped widening in H2 2025 for the first time since 2022.

The public-to-private gap tells the same story from a different angle. McKinsey reported in March 2026 that listed real estate trades at implied cap rates roughly 130 basis points above private-market appraisals, narrowed from roughly 240 basis points in 2023.

What this means for your input: a 25 or 50 basis point test is conservative against observed dispersion. If your deal only works at the exact cap rate you entered, it does not yet have a margin of safety.

Who Should Use This Calculator?

The tool is built for anyone who screens deals in volume and needs to sort quickly:

  • Acquisitions and investment teams working through broker packages and offering memoranda
  • Individual and emerging investors checking whether an asking price is defensible
  • Asset managers running quick hold-versus-sell checks on assets they already own
  • Brokers and advisors setting pricing expectations with a seller
  • Lenders and credit teams testing a sponsor's stated value before deeper review

This is a screening tool. Use it to decide which deals earn a full underwriting analysis.

What Is NOI in Real Estate?

Net operating income (NOI) is a property's income after operating expenses and before debt service, income taxes, and depreciation. Capital expenditures, tenant improvements, and leasing commissions also sit outside the figure.

The estimate is only as good as this number. Trailing twelve-month NOI shows what the property has actually produced. Pro forma NOI shows what someone expects it to produce. Those two figures often differ by 10% or more on the same asset, and the calculator cannot tell which one you entered.

A few items quietly inflate a stated NOI. Watch for one-time income, an expense year that excludes a full property tax reassessment, an understated management fee, and a missing replacement reserve. Each one lifts the calculated value without changing the building. Our guide to commercial real estate valuation reports covers how these adjustments are documented.

What Is a Cap Rate, and How Do You Calculate It?

The capitalization rate is the unlevered annual return a property produces at a given price. Divide NOI by value and you have the cap rate. A property with $200,000 of NOI selling for $4,000,000 trades at a 5.00% cap rate.

Cap rates reflect asset class, submarket, building quality, tenant credit, lease term, and the risk you accept compared with other places to put the money. A lower cap rate means a higher price for the same income and usually signals lower perceived risk.

What Is a Good Cap Rate?

There is no universal answer, and any source that gives you one is guessing. Your target cap rate is a judgment about required return, anchored in recent comparable sales in the same submarket and asset class. We unpack the common misreading of this metric in is a higher or lower cap rate better in CRE.

The market data above makes the point. NCREIF is also clear that its published cap rates are meant to show trends and should not be used to value a specific property, and CBRE notes that individual assets occasionally trade outside its stated ranges based on location, quality, and property-specific characteristics.

Comparable evidence informs your input. It does not replace it. See how AI supports commercial property cap rate estimation for a faster way to build that evidence base.

What the Results Do and Do Not Represent

The output is a preliminary value indication at a single cap rate. Treating it as your maximum bid would be a mistake. The calculator has no visibility into the factors that usually decide what a buyer can actually pay.

The estimate excludes:

  • Debt structure. Loan proceeds, interest rate, amortization, DSCR and debt yield tests, and reserve requirements often cap what you can pay well below a cap rate target.
  • Return requirements. Levered IRR, equity multiple, and hold period drive most institutional pricing decisions. None of them appear here, and the difference between these measures is covered in cap rate vs ROI.
  • Capital needs. Deferred maintenance, roof and system replacements, tenant improvements, and leasing commissions all reduce what the income stream is worth.
  • Lease and tenant risk. Rollover concentration, weighted average lease term, tenant credit, and below-market rents sit outside a single-year NOI figure.
  • Transaction costs. Closing costs, financing fees, and working capital at closing.
  • Market evidence. The tool uses the cap rate you supply. It does not check that figure against comparable sales for the specific submarket, vintage, and asset quality.

The calculator answers one question well: what a given income stream is worth at a given return threshold. Everything past that needs the underlying documents.

When Do You Need Full Underwriting?

Move past the screening estimate once a deal clears the first filter. Our overview of 2026 commercial underwriting principles and best practices covers what that work involves. The point usually arrives when you are:

  • Preparing an LOI or entering a competitive bid
  • Sizing debt and testing DSCR, debt yield, and loan-to-value limits
  • Building a multi-year cash flow with lease-by-lease rollover assumptions
  • Taking a deal to an investment committee or a credit committee
  • Reforecasting an asset you own ahead of a refinance or sale, or running portfolio stress testing

Each of these requires reconciling the rent roll, operating statements, leases, and market data into one defensible model. Most acquisition timelines are lost in that reconciliation.

Screen Faster, Underwrite Deeper

Direct capitalization is the right tool for the first thirty seconds of a deal. It tells you whether an asking price sits inside the range of reason at the return you require. The sensitivity table tells you how fragile that answer is.

Deals that survive the screen need more. See how Smart Capital Center builds a complete, source-linked underwriting analysis from property documents and market data.

Put the calculator's estimate to the test on a live deal. Book a demo today.

Frequently Asked Questions

How do you calculate the maximum purchase price for a commercial property?

Divide the property's annual net operating income by your target cap rate. At $200,000 of NOI and a 5.00% target, the maximum purchase price is $4,000,000. This is the direct capitalization method, and it gives you a preliminary value at one return threshold. It does not account for debt, capital costs, or your equity return requirements.

Should I enter trailing or pro forma NOI?

Start with trailing twelve-month NOI, since the seller can document it. Then run the pro forma figure separately and compare the two results. The gap between them tells you how much of the asking price depends on projections instead of history. Smart Capital Center's AI reads both from the actual operating statements and flags the line items driving the difference.

What does a 6% cap rate mean?

A 6% cap rate means the property produces an unlevered annual return of 6% of the purchase price. A building with $300,000 of NOI at a 6% cap rate is worth $5,000,000. Higher cap rates generally mean higher perceived risk and a lower price for the same income.

Why is my estimate lower than the asking price?

A higher asking price means the seller is pricing to a lower cap rate than your target. The Cap Rate at Asking Price output shows the exact return that price delivers. In the example above, a $4,500,000 ask against $200,000 of NOI implies a 4.44% cap rate, which is 56 basis points below a 5.00% target.

Does the calculator account for financing?

No. The output is an unlevered value indication. Loan proceeds, interest rate, amortization, DSCR, and debt yield tests often produce a lower practical maximum than a cap rate target alone. Smart Capital Center models debt structure alongside the valuation so you can see both constraints together, an approach covered in our piece on how AI is changing commercial real estate underwriting.

How much should I move the assumptions when testing?

The table's 25 and 50 basis point cap rate steps and 5% and 10% NOI steps are conservative against observed dispersion. NCREIF recorded a 70 basis point gap between appraisal and transaction cap rates in Q1 2026, and CBRE's H2 2025 survey reports office estimates in bands roughly 100 basis points wide.

Why do appraised values and sale prices disagree?

Appraisals reprice more slowly than markets do. Jim Costello of MSCI notes that appraisals do not happen quickly, and that resetting pricing assumptions after conditions change takes real work while credit markets now move faster and more transparently. That lag is what produces the gap between an appraisal-based cap rate and a transaction cap rate in the same quarter. Smart Capital Center reconciles both perspectives against the property's own documents.

How does Smart Capital Center help with purchase price analysis?

Smart Capital Center builds a full underwriting analysis from the property's own documents, reconciles income and expense detail against market benchmarks, and tests pricing under different debt and return assumptions. Every number stays linked to its source, so the analysis holds up in an investment committee. Book a demo to see it on one of your deals.

Now run your own numbers

Open the free CRE Maximum Purchase Price Calculator, enter any NOI, cap rate and asking price, and see the full sensitivity picture for your deal.

Try the Calculator

Trusted by commercial real estate leaders

Real stories. Real results.

See what our customers are saying

30x Productivity Gain

Smart Capital's capability to extract, standardize, and analyze data from property financials, combined with automated reconciliations and analyses, has already transformed our operations.Instead of the 30-40 minutes, it took us previously to process a single financial statement, it now takes 1-3 minutes with Smart Capital.

Director of Asset Management

JLL

Removed Most of the Manual Work

Smart Capital has removed most of the manual work that was taking a lot of time from our team. The solution allows us to focus on more productive, higher-level work, and we get the results much faster.

Top US insurance company

Credit Risk Manager

Top US insurance company

40% Less Time to Prepare Financial Model

We are midway through our implementation of Smart Capital and we already achieved a 40% reduction in the time required to prepare a financial model for a loan.


KeyBank Logo

Senior Vice President

Key Bank

Smart Capital allows us to transform our business

Smart Capital allows us to transform our business. My team and I are more confident that our decisions are more objective, data-driven, which minimizes our risk.

Commercial Mortgage
Lender Logo

Chief Risk Officer

Commercial Mortgage Lender

We Can Pre-Screen More Deals

Smart Capital Center has become an integral part of our initial underwriting and loan analysis. With the platform, we can review significantly more applications with greater depth and consistency, allowing us to identify and prioritize the strongest opportunities aligned with our affordable housing finance mission. We’re not just working faster—we’re focusing our underwriting attention where it’s needed most. These efficiencies allow us to pre-screen more projects, expand our impact and direct capital to the most viable projects and communities that need it most.

Commercial Mortgage
Lender Logo

Kelly Boyer, President

Rose Community Capital

We Can Underwrite a Deal in a Week Instead of a Month

It's a lot easier now to have a team that helps me. The end product is so detailed that the finance brokers were impressed — sponsors usually don't hand over that kind of underwriting. The software and the scrubbing capability with the AI has been enormous. As a sponsor, you must know your numbers cold, and Smart Capital Center lets me do that.

Top US insurance company

George Arce, Jr., President and CEO

Center Dynamic Partners