


CRE Investors

September 25, 2026
CRE Investors
September 25, 2026

According to NCREIF's Property Index Trends report, only around 500 properties in the index actually sell in a given year, which means most cap rates cited in a valuation are appraisal-based estimates, not confirmed transaction prices. That distinction matters because cap rate, yield on cost, and debt yield get used interchangeably by people who calculate them every week, and each answers a different question. Cap rate prices an asset against its current income. Yield on cost measures what a business plan produces on total dollars invested. Debt yield tells a lender what it earns on the loan if it has to take the property back. Using the wrong one produces a confident wrong answer, and the error usually shows up at sizing.
This analysis draws on Smart Capital Center, a commercial real estate database and underwriting platform that calculates yield metrics from reconciled property financials and benchmarks assumptions against 120M+ properties, 1B+ signals, and $500B+ analyzed, to lay out how investors and lenders use all three metrics correctly.
Cap rate divides net operating income by property value or price, and it answers what an asset is worth today based on current income. Yield on cost divides stabilized net operating income by total project cost, and it answers what a business plan produces on every dollar spent, including the purchase price and capital improvements. Debt yield divides net operating income by the loan amount, and it answers what a lender earns relative to its exposure, independent of the interest rate charged. All three use net operating income in the numerator, which is exactly why they get confused, but the denominator changes the question each one is answering.
● Net operating income: property revenue less operating expenses, before debt service, capital expenditure, and taxes.
● Capitalization rate: net operating income divided by property value or price.
● Going-in cap rate: the cap rate at acquisition, based on in-place or first-year income.
● Exit cap rate: the cap rate assumed at sale in an underwriting model.
● Yield on cost: stabilized net operating income divided by total project cost, including purchase price, capital expenditure, and carrying costs.
● Development spread: the difference between yield on cost and the market cap rate for a comparable stabilized asset.
● Debt yield: net operating income divided by the loan amount.
● Debt service coverage ratio: net operating income divided by annual debt service.
● Positive leverage: the condition where the cap rate exceeds the cost of debt, so borrowing raises the return on equity.
Cap Rate = Net Operating Income ÷ Property Value or Price
A cap rate compresses a property's income and its price into a single number, which is what makes it useful for a quick comparison and dangerous when applied without checking what income period it reflects.
The going-in cap rate uses in-place or first-year income against the purchase price, and it describes the return an investor is buying on day one. The exit cap rate is an assumption, applied to projected income at the end of a hold period to estimate a future sale value. Underwriting models commonly assume an exit cap rate 25 to 50 basis points above the going-in rate, reflecting the uncertainty of a value further out in time, though this convention should be tested against current market evidence.
A transaction cap rate comes from an actual closed sale. An appraisal cap rate comes from a valuation professional's estimate, informed by comps but not confirmed by a transaction. Because only a small share of institutionally tracked properties change hands in a given year, appraisal cap rates dominate the data most investors see, and they tend to lag transaction cap rates in a moving market. Newmark's 2Q26 U.S. Capital Markets Conditions and Trends report found transaction cap rates held largely flat outside industrial through the second quarter, which is useful context: a flat transaction cap rate environment means appraisal-based comps are less likely to be stale than they would be during a period of rapid repricing.

Yield on Cost = Stabilized Net Operating Income ÷ Total Project Cost
Total project cost includes the purchase price, capital expenditure, and carrying costs during any lease-up or renovation period, which makes yield on cost a forward-looking measure of what a completed business plan produces.
Development Spread = Yield on Cost − Market Cap Rate
The development spread compares what a project produces on cost against what a stabilized comparable asset trades for in the market. A wide spread signals the business plan creates value beyond simply buying a finished asset. A spread near zero signals the execution risk of a renovation or lease-up is not being compensated with enough additional yield to justify taking it on.
Debt yield is a lender's sizing metric that measures net operating income against the loan amount, independent of the interest rate, the amortization schedule, or the term. Lenders use it because a coverage ratio can look acceptable at a low rate and still leave a lender under-protected if that income were the only thing standing behind a much larger loan.
CRE Debt Yield = Net Operating Income ÷ Loan Amount
A property with $1,200,000 in NOI and a $10,000,000 loan has a debt yield of 12.0 percent. The same NOI against a $16,000,000 loan produces a debt yield of 7.5 percent, a meaningfully weaker cushion even though the property itself has not changed.
Debt yield does not soften when rates fall, which is what distinguishes it from a coverage ratio. A lower rate reduces debt service, which improves coverage, but the loan amount and NOI used in debt yield are unaffected by the rate charged. This is why debt yield can become the binding constraint in a lower-rate environment even when coverage looks comfortable, and why Trepp's July 2026 CMBS delinquency data, showing CMBS delinquency at 7.86 percent with non-performing matured balloon loans at 66 percent of newly delinquent balances, reflects loans that likely cleared a coverage test at origination but were sized against income that did not hold up.
Minimum debt yield requirements typically run from 8 to 12 percent depending on property type, lender, and loan structure, with construction and transitional loans generally requiring the higher end of that range to compensate for execution risk. A debt yield below roughly 8 percent is generally viewed as thin cushion for a stabilized asset, though the right threshold depends on the lender's own risk appetite and the property type in question.

Consider a 100,000-square-foot industrial building purchased for $15,000,000, with $1,000,000 in planned capital expenditure bringing total project cost to $16,000,000. In-place NOI at acquisition is $975,000, and NOI is projected to stabilize at $1,200,000 once the capex program and lease-up are complete. The acquisition is financed with a $10,000,000 loan.
The same property produces three different numbers because each metric is answering a different question: what the asset is worth today, what the completed business plan will produce on total dollars spent, and what cushion a lender has if the loan needs to be worked out.
With the 10-year Treasury forecast to average 4.2 percent in 2026, according to the Mortgage Bankers Association's 2026 CREF Forecast, an all-in commercial mortgage rate in the neighborhood of 6.0 to 6.5 percent is a reasonable planning assumption for a stabilized asset. When the going-in cap rate exceeds the cost of debt, borrowing is positive leverage: a 6.50 percent cap rate against a 6.00 percent cost of debt raises the return on equity relative to an all-cash purchase. When the cost of debt exceeds the cap rate, leverage works in reverse, and a 6.50 percent cap rate against a 7.00 percent cost of debt reduces the equity return below what an unleveraged purchase would produce. Checking this relationship before assuming debt automatically improves a deal's return is worth doing on every acquisition.
Coverage and debt yield can produce different maximum loan amounts on the same property, and whichever produces the lower number sets what the deal can actually support. In a falling-rate environment, coverage loosens while debt yield stays fixed, which means debt yield increasingly determines the ceiling on proceeds.
Small rate and cap rate movements produce outsized effects on value, proceeds, and the equity check required to close.
On the $1,200,000 stabilized NOI used in the worked example, moving the cap rate from 6.50 to 6.75 percent reduces value by roughly $684,000, and moving it a further 25 basis points to 7.00 percent reduces value by another $635,000. On the debt side, moving the interest rate from 6.00 to 6.50 percent under a 1.25x coverage requirement reduces the maximum supportable loan by roughly $687,000, which is capital an equity check has to replace if proceeds were sized at the tighter number.
● A cap rate calculated on unstabilized income, such as a property still in lease-up, understates the true going-in return an investor is actually buying once occupancy normalizes, or overstates it if the trailing income included a one-time item.
● A yield on cost built on an optimistic construction or renovation budget looks attractive on paper and collapses once change orders and delays push total project cost above the original estimate.
● A debt yield calculated on projected NOI gives a lender comfort that has not been earned yet, which is precisely the pattern behind many of the matured balloon loans now showing up in delinquency data.
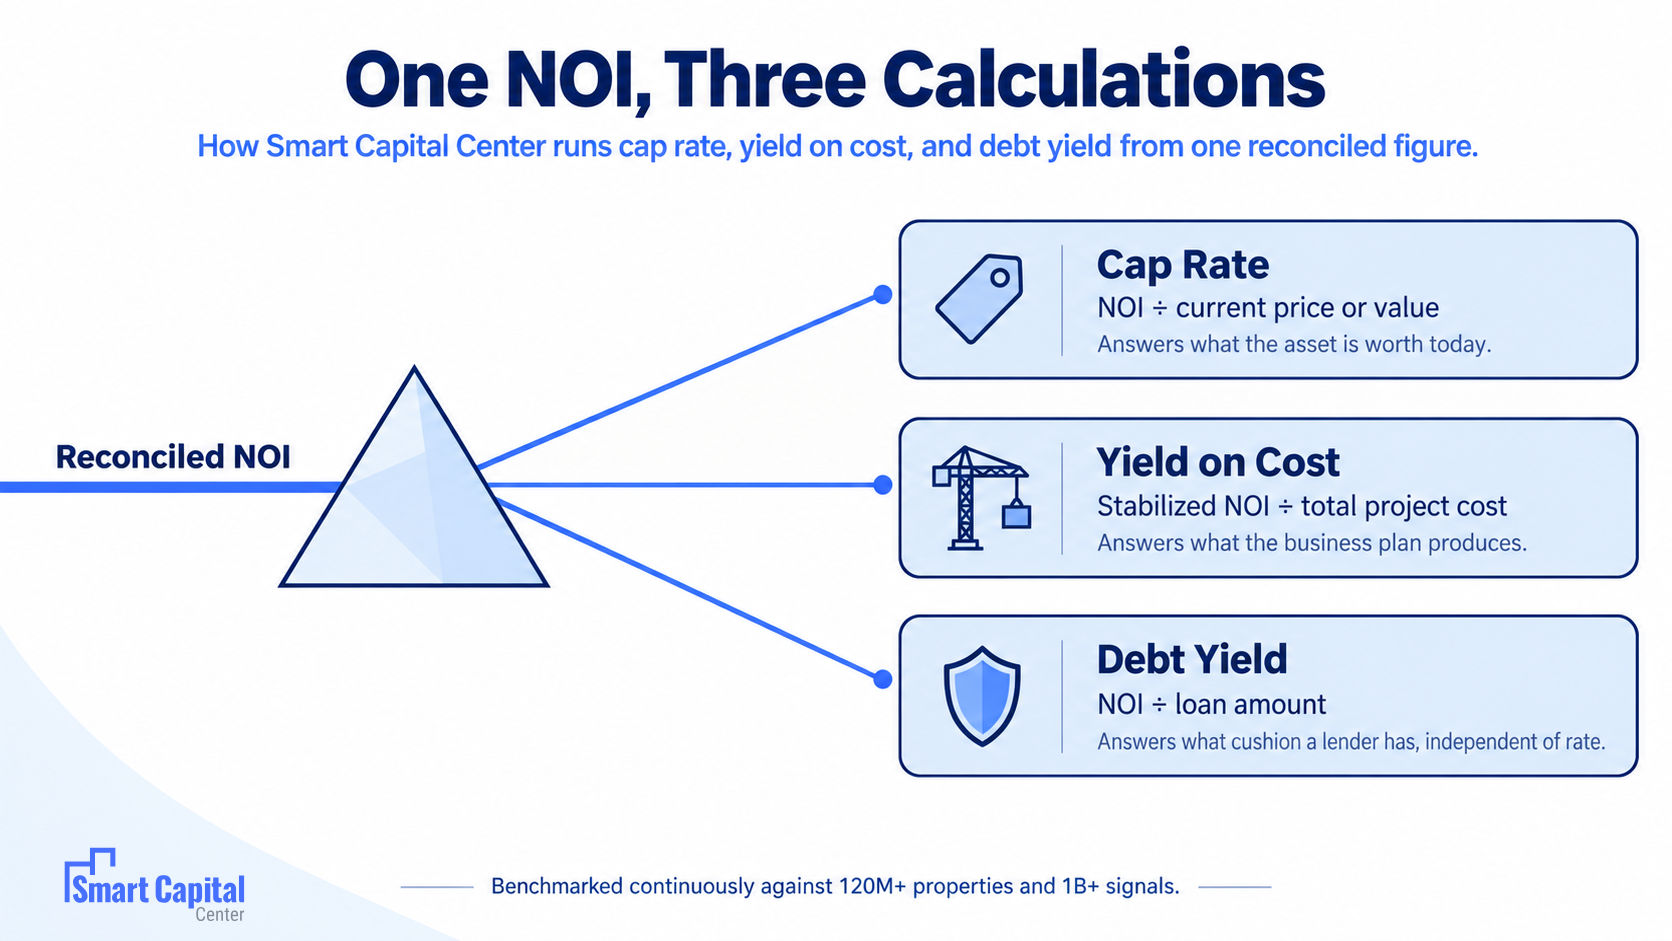
Running cap rate, yield on cost, and debt yield in a consistent order keeps the three metrics from being calculated on inconsistent income figures.
1. Confirm the NOI figure being used for each calculation, in-place, stabilized, or projected, and label it explicitly.
2. Calculate the going-in cap rate against the purchase price using in-place income.
3. Calculate yield on cost against total project cost using stabilized income, once the business plan and capex budget are finalized.
4. Calculate debt yield against the proposed loan amount, checking it against both in-place and stabilized NOI to see how the cushion changes over the hold.
5. Compare the going-in cap rate against the anticipated cost of debt to confirm whether leverage is working for or against the equity return.
6. Run coverage and debt yield side by side at the proposed loan amount, and take the lower resulting proceeds figure as the binding constraint.
7. Stress-test the cap rate and interest rate assumptions by 25 and 50 basis points to see how much cushion the deal actually has before committing capital.
Cap rate, yield on cost, and debt yield share an NOI numerator and nothing else, and knowing which question each one answers prevents the expensive mistake of using one metric's comfort level to justify a decision that actually depends on another. Smart Capital Center supports this by calculating all three from reconciled property financials and stress-testing rent, expense, cap rate, and interest rate assumptions across a property or a full portfolio, so every figure an analyst brings to committee is traceable to the document behind it. For more on how these assumptions are validated at scale, see How AI Validates CRE Underwriting Assumptions at Scale.
Run cap rate, yield on cost, and debt yield from the same reconciled numbers, every time.
Book a demo with Smart Capital Center →
Q: What is commercial real estate debt yield?
A: Debt yield is net operating income divided by the loan amount, and it measures what a lender earns relative to its loan exposure independent of the interest rate. Lenders use it as a sizing constraint because, unlike a coverage ratio, it does not improve when rates fall.
Q: How do you calculate debt yield?
A: Divide net operating income by the loan amount. A property with $1,200,000 in NOI and a $10,000,000 loan has a debt yield of 12.0 percent, calculated the same way regardless of the interest rate or amortization schedule attached to the loan.
Q: What is the difference between cap rate and yield on cost?
A: Cap rate divides net operating income by property value or price and answers what an asset is worth today. Yield on cost divides stabilized NOI by total project cost and answers what a completed business plan produces on every dollar spent, including capital improvements.
Q: How do I calculate yield on commercial property?
A: For a going-in cap rate, divide in-place NOI by the purchase price. For yield on cost, divide stabilized NOI by total project cost, including the purchase price, capital expenditure, and carrying costs during lease-up or renovation.
Q: Why does debt yield matter more than coverage in some deals?
A: Coverage improves when interest rates fall, since lower rates reduce debt service, but debt yield does not move with the rate at all. In a falling-rate environment, debt yield can become the tighter constraint even when the coverage ratio looks comfortable, which is why lenders check both.
Q: What is a development spread, and why does it matter?
A: A development spread is the difference between yield on cost and the market cap rate for a comparable stabilized asset. A wide spread signals the business plan is creating value beyond simply buying a finished property, while a spread near zero signals the execution risk may not be adequately compensated.
Q: How does a 25 or 50 basis point move affect commercial property value?
A: Because cap rate and value move inversely, even a small increase in the cap rate reduces value, and the effect compounds at lower cap rates where each basis point represents a larger share of the multiple. On a stabilized NOI of $1,200,000, moving the cap rate from 6.50 to 6.75 percent reduces value by roughly $684,000.
Q: How does Smart Capital Center help with commercial real estate portfolio yield comparison methods?
A: It calculates cap rate, yield on cost, and debt yield from the same reconciled property financials across an entire portfolio, so every asset is compared on a consistent basis. Rose Community Capital reviews significantly more applications with greater depth and consistency, according to Kelly Boyer, President.