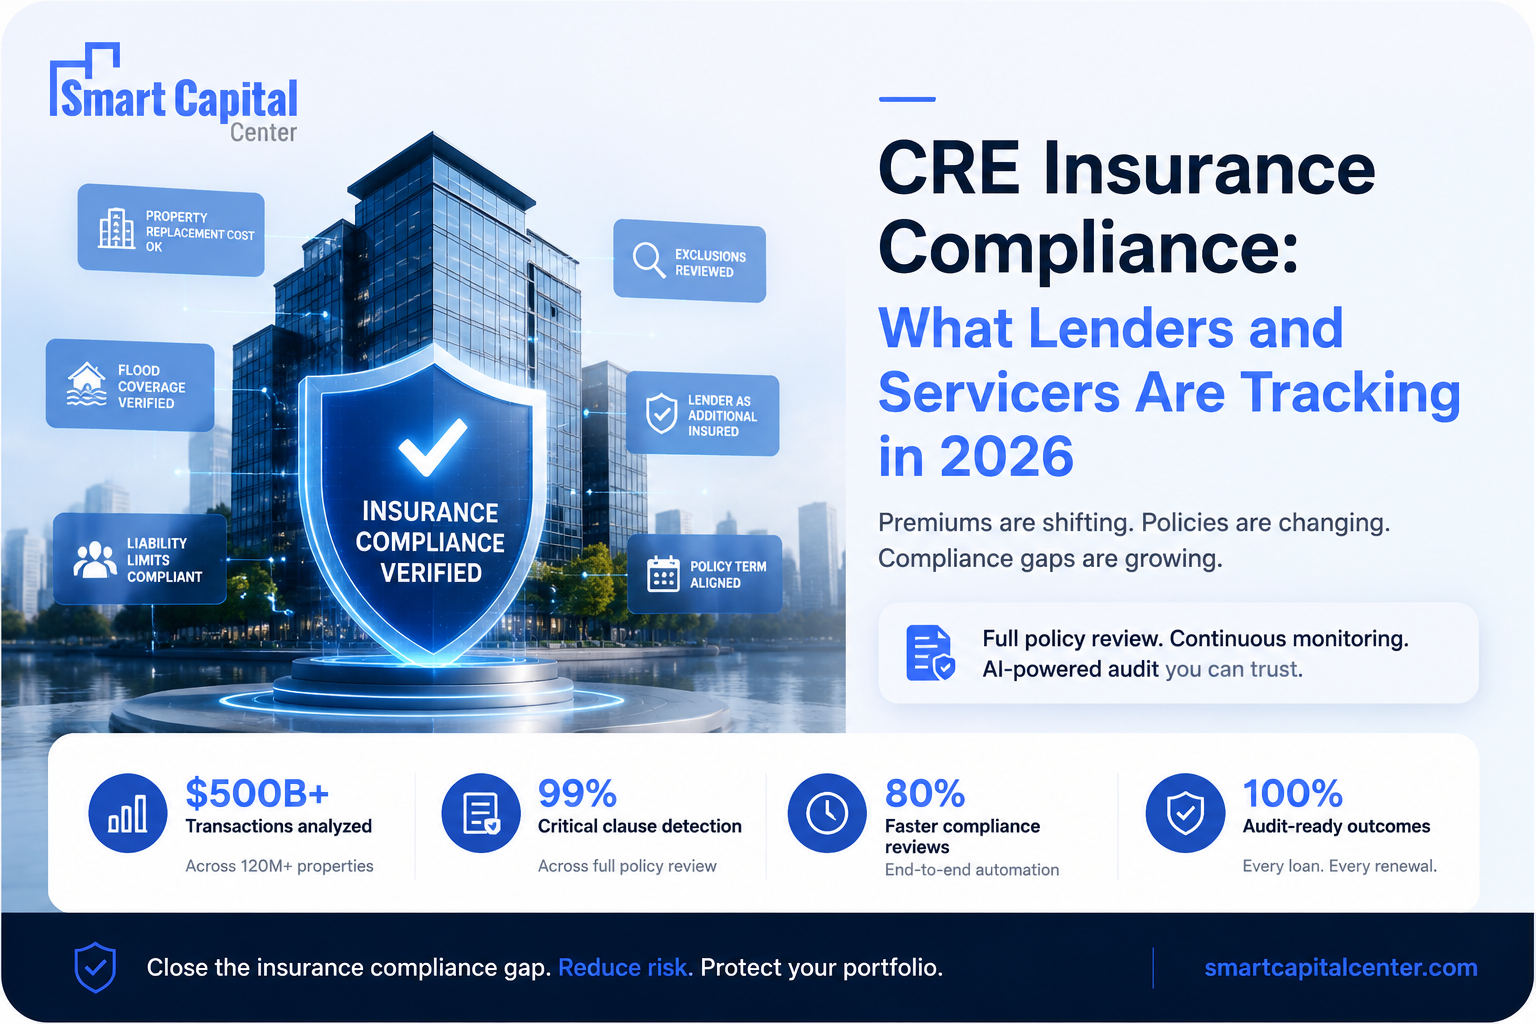
CRE Investors
March 23, 2026
CRE Investors
March 23, 2026

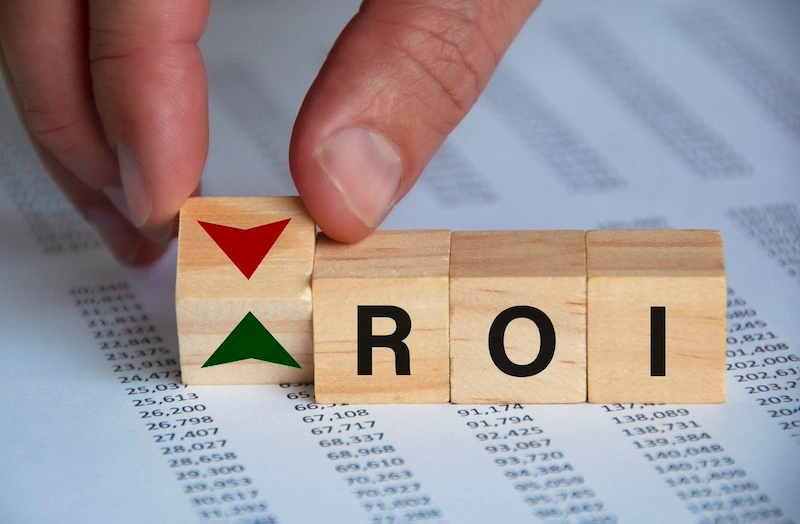
Every CRE investor faces this question: Should I focus on cap rate or ROI?
The answer isn't either/or. Understanding cap rate vs ROI means recognizing that both metrics serve different but complementary purposes. Use them wrong, and you risk missing hidden costs or overestimating returns.
According to NAREIT, institutional investors who use multiple performance metrics achieve 2-3% higher returns annually compared to those relying on single measures.
Smart Capital Center calculates both metrics automatically from uploaded financial documents. The platform provides instant ROI and cap rate analysis, showing how each metric reveals different aspects of property performance. This dual perspective helps investors make better-informed decisions.
This guide explains the difference between cap rate and ROI, when to use each metric, and how they work together. You'll learn to interpret both measures and apply them strategically for superior investment outcomes.
No. Cap rate and ROI measure different aspects of property performance.
Cap rate (capitalization rate) measures property-level return independent of financing:
Formula: Cap Rate = Net Operating Income (NOI) / Property Value
ROI (return on investment) measures total return including financing, appreciation, and all cash flows:
Formula: ROI = (Gain from Investment - Cost of Investment) / Cost of Investment
Key insight: Cap rate answers "What does the property earn?". ROI answers "What do I earn as an investor?"
Cap rate reveals property performance as if purchased with all cash.
Cap rate focuses on:
• Operating income only: NOI after expenses, before debt service
• Current year performance: Based on annual income, not appreciation
• Property value: Uses total property price, not investor equity
• Financing-independent: Ignores debt structure completely
Example:
• Property value: $10,000,000
• Annual NOI: $700,000
• Cap rate: 7.0%
This cap rate applies whether you pay all cash or finance 80%. The property yields 7% based on its operating performance.
Cap rate excels for:
• Quick property comparison: Compare assets with different financing structures
• Market pricing analysis: Determine if asking prices are reasonable
• Valuation estimates: Apply market cap rates to NOI for property values
• Risk assessment: Lower cap rates signal lower risk and higher quality

ROI captures total investor return including all factors cap rate ignores.
ROI includes:
• Operating income: Cash flow after debt service
• Property appreciation: Value increase over holding period
• Equity buildup: Mortgage principal paydown
• Tax benefits: Depreciation and other deductions
• Actual equity invested: Based on down payment and closing costs, not total price
Example:
• Property purchase: $10,000,000
• Down payment (25%): $2,500,000
• Closing costs: $150,000
• Total investment: $2,650,000
• Hold 5 years, sell for $12,000,000
• Total cash flow during hold: $1,200,000
• Loan paydown: $350,000
• Total gain: $2,000,000 appreciation + $1,200,000 cash flow + $350,000 equity = $3,550,000
• ROI: $3,550,000 / $2,650,000 = 134% over 5 years
ROI works best for:
• Investment performance tracking: Measure actual returns on capital deployed
• Portfolio analysis: Compare different investment types (stocks vs real estate)
• Exit strategy evaluation: Determine optimal sale timing for maximum returns
• Investor reporting: Show limited partners or stakeholders total returns
This comparison clarifies when to use each metric.
See how both metrics reveal different insights on the same property.
Property details:
• Purchase price: $5,000,000
• Down payment: $1,250,000 (25%)
• Annual NOI: $350,000
• Annual debt service: $225,000
• Annual cash flow: $125,000
• Property appreciates 3% annually
Cap rate calculation:
$350,000 NOI / $5,000,000 value = 7.0% cap rate
Year 1 ROI calculation:
$125,000 cash flow / $1,250,000 invested = 10.0% cash-on-cash return
5-year total ROI:
• Cash flow (5 years): $625,000
• Appreciation: $796,350 (3% compounded)
• Equity buildup: $180,000
• Total gain: $1,601,350
• ROI: $1,601,350 / $1,250,000 = 128% over 5 years
Insight: The 7% cap rate shows property-level performance. The 128% ROI shows investor returns amplified by leverage and appreciation. Both metrics matter.
Smart investors leverage both metrics at different stages.
Use cap rate to:
• Screen opportunities quickly
• Compare properties in different markets
• Assess pricing relative to income
• Identify undervalued assets
Use ROI to:
• Project total returns including financing
• Model different leverage scenarios
• Compare against investment hurdle rates
• Evaluate risk-adjusted returns
Track cap rate to:
• Monitor property operating performance
• Benchmark against market trends
• Estimate current market value
• Identify when cap rates compress (good for sale timing)
Track ROI to:
• Measure actual investor returns
• Report performance to stakeholders
• Decide when to refinance or sell
• Compare against alternative investments
Smart Capital Center calculates both metrics automatically from uploaded financial data. The platform tracks performance over time, showing how cap rates and ROI evolve across your portfolio.
Avoid these errors that distort investment decisions:
1. Using only cap rate for leveraged deals: Misses the impact of financing on actual returns
2. Using only ROI for property comparison: Different financing distorts apple-to-apple comparisons
3. Confusing cap rate with cash-on-cash: Cap rate ignores debt; cash-on-cash includes it
4. Forgetting appreciation in ROI: ROI should include value increase, not just cash flow
5. Ignoring time value of money: Simple ROI doesn't account for when returns occur
The cap rate vs ROI debate misses the point. Both metrics serve essential but different purposes.
Cap rate measures property-level performance independent of financing. Use it for quick comparisons, market pricing analysis, and valuation estimates. It answers: What does the property earn?
ROI measures total investor returns including financing, appreciation, and equity buildup. Use it for performance tracking, exit timing, and investor reporting. It answers: What do I earn?
Understanding the difference between cap rate and ROI enables smarter decisions. Start with cap rate to screen opportunities. Use ROI to evaluate actual returns and compare against alternatives.
Smart Capital Center calculates both metrics automatically. Upload financial documents and the platform generates instant cap rate and ROI analysis. Track both metrics across your portfolio. See how they evolve over time. Make better-informed investment decisions.
Ready to analyze properties faster? Book a demo and see how Smart Capital Center provides instant cap rate vs ROI in real estate analysis.
Which is more important: cap rate or ROI?
Neither is more important. Cap rate measures property performance independent of financing. ROI measures total investor returns. Use cap rate for property comparison and valuation. Use ROI for investment performance tracking. Both provide essential but different insights.
Can ROI be higher than cap rate?
Yes, frequently. Leverage amplifies returns when cap rate exceeds borrowing cost. A 7% cap rate property with 70% financing at 5% interest typically generates 10%+ ROI on invested equity. The difference comes from leveraging other people's money.
How do I calculate ROI for real estate?
ROI = (Total Gain - Total Investment) / Total Investment. Total gain includes cash flow, appreciation, and equity buildup. Total investment includes down payment and closing costs. For a 5-year hold: sum all cash flows, add appreciation, add principal paydown, divide by initial investment.
Does cap rate include mortgage payments?
No. Cap rate calculates property-level return before debt service. It equals NOI divided by property value, completely independent of financing. This makes cap rate useful for comparing properties with different financing structures on an apples-to-apples basis.
Can cap rate tell me if a property is overpriced?
Yes. Compare the property's cap rate against market averages for similar assets. If comparable properties trade at 6.5% cap rates and your target is priced at 5.0%, it may be expensive relative to income. However, lower cap rates might be justified by superior quality or location.