October 21, 2026
October 21, 2026

Most discussion of the debt service coverage ratio treats it as a lending requirement. A lender sets a minimum, the deal clears it, everyone moves on. Framed that way, the number is a hurdle to pass at closing.
Owners who hold assets through cycles treat it as something else entirely. For them coverage is the arithmetic expression of how much debt a property can carry, and the distance between the covenant and the operating reality is the room they have to survive a bad two years. Several of them run two or three times the number their banks ask for, on purpose, and gave their reasons on the record.
Smart Capital Center tests coverage against the definition that actually governs each loan, in real time as financials post, with a separate configurable column for covenant calculations that differ from core underwriting. A later section covers why that difference exists and what it costs when nobody tracks it.
This article draws on a session at the IMN Real Estate Private Funds Summer conference in Newport in June 2026, titled "Cash flowing properties & long term holds: should investors favor certainty?" The panel covered the coverage they run, the loan-to-value they hold to, the trade they make between primary and secondary markets, and what they learned from the last cycle.
The formula divides a property’s annual net operating income by its annual debt service. A ratio of 1.0 means income exactly covers the payments, anything above 1.0 is cushion, and anything below means the property is not producing enough to service its debt.
DSCR = Net Operating Income ÷ Annual Debt Service
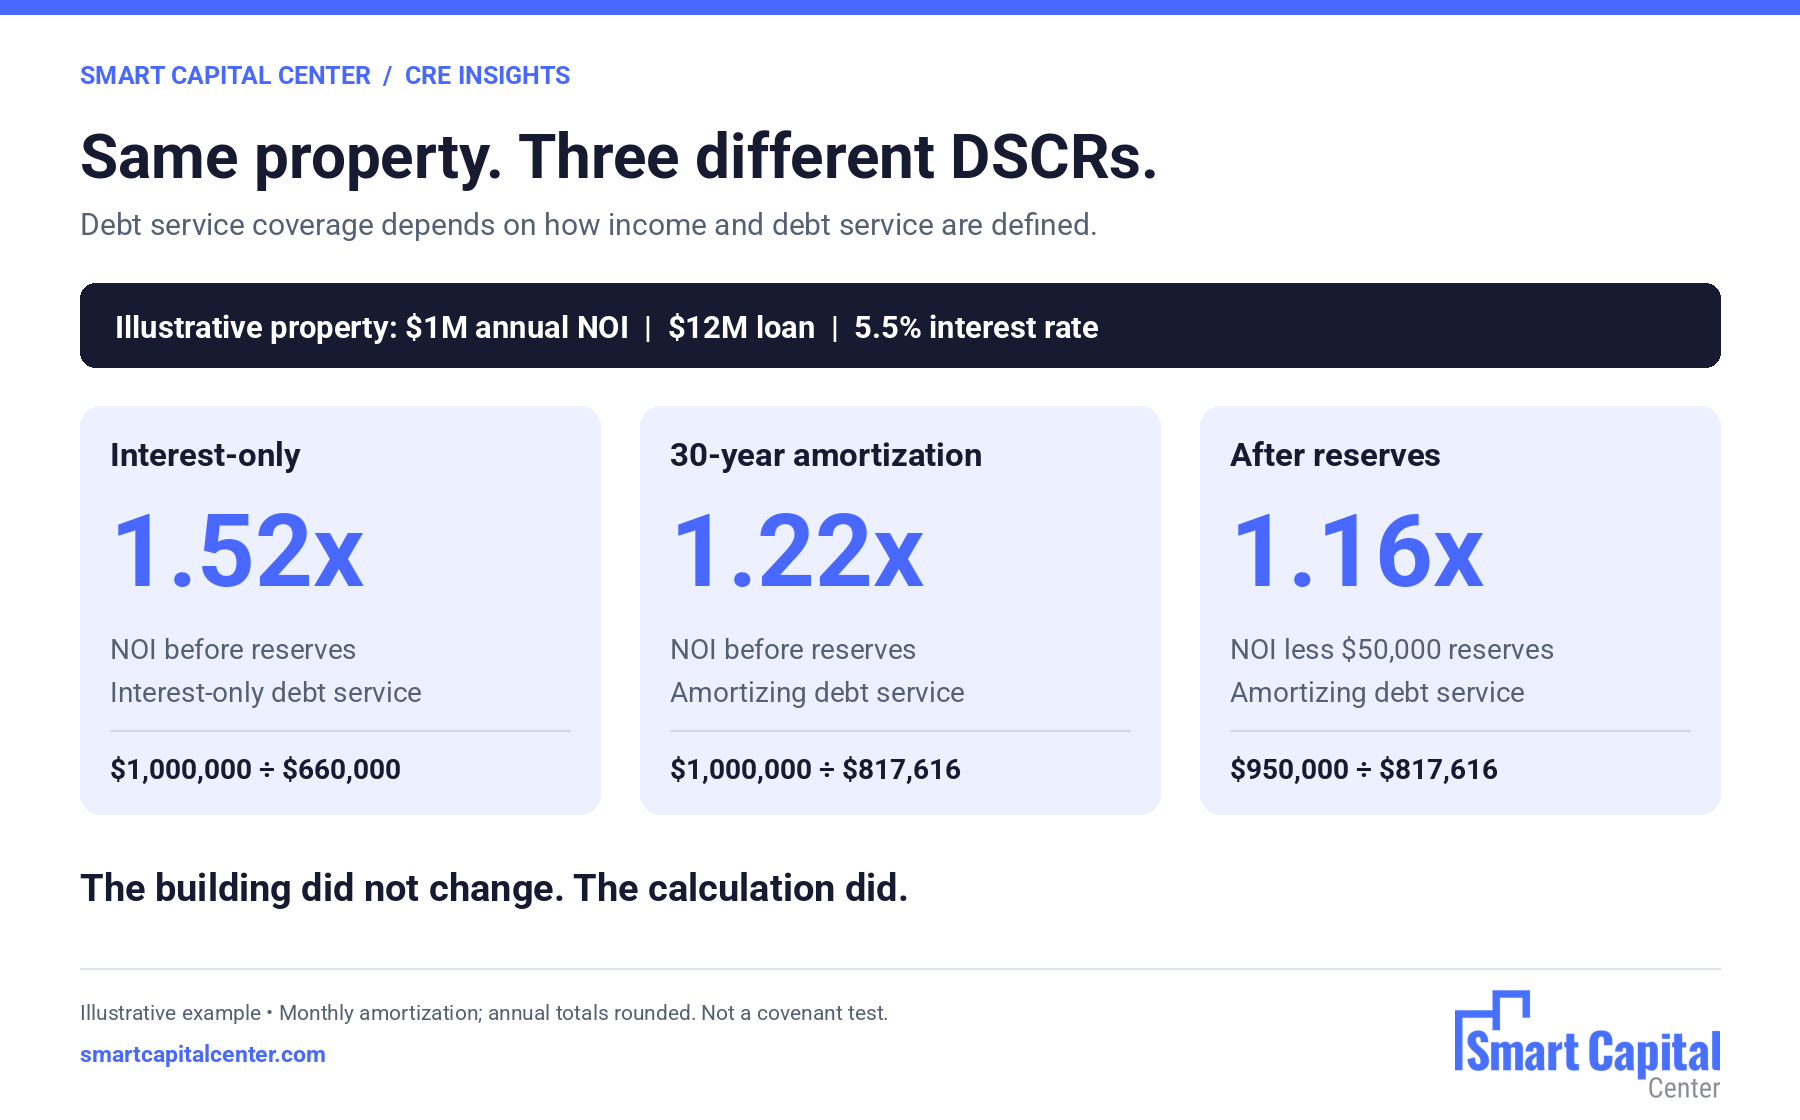
The arithmetic is simple and the inputs are not. Consider an illustrative 200-unit property with $1,000,000 of net operating income and a $12,000,000 loan at 5.5 percent. Three defensible calculations produce three different answers.
Nothing changed about the building. The rent roll, the expenses, and the loan balance are identical across all three rows. What changed is whether debt service reflects amortization the owner is not yet paying, and whether reserves come out of the numerator. A 1.52 and a 1.16 on the same asset is the difference between comfortable and close to a covenant.
Andy Weiner, President of RockStep Capital, which owns roughly 10 million square feet of shopping centers across 11 states in secondary and tertiary markets, gave the clearest numbers on the panel. Community banks lending on enclosed malls, he said, do not like the word mall but they do like the words debt service coverage, and they typically want to see 1.25 coverage. His firm generally runs between 2.75 and 3.5 times on those assets. In open-air centers in the same markets he put typical bank expectations at 1.75 to 2 times.
That gap is the practical answer to what a good coverage ratio is. The covenant sets a floor. The operating ratio is a business decision about how much room an owner wants in a downturn, and the owners on this panel wanted a great deal of it.
Weiner also described what the coverage buys beyond the covenant. His firm deliberately raises LP equity from local business leaders in the markets where it buys, and those partners frequently own or sit on the board of the local bank. That relationship plus coverage at those levels produces flexible debt with no prepayment penalties, the kind of arrangement where a refinance is a phone call. His rule is firm: unless the firm gets local joint venture partners who are heavy hitters in that market, it will not invest at all. In Bowling Green, Kentucky he described seven local investors with real influence downtown, found largely through local brokers.
Weiner’s coverage levels are a function of where he buys, and he explained the trade precisely. Credit quality does not vary by geography the way rent does. TJ Maxx credit is the same in Bowling Green as it is in Dallas, but the Bowling Green store pays $11 a foot while the Dallas store pays $20. The Bowling Green asset trades at an 8.25 cap and the Dallas asset at a 7.25 cap. He likes that trade, and added that there is no vacancy in Bowling Green and essentially no chance the anchor declines its renewal option. For scale, he put the city at 75,000 and the market at 200,000, growing faster than Nashville.
Not everyone on the panel agreed on where that cash flow lives. Henry Manoucheri, Chairman and CEO of Universe Holdings, which operates roughly 18,000 multifamily units across California, Florida, and New Jersey, said his firm buys only primary markets and does so specifically for appreciation. He described families who bought on Rodeo Drive decades ago at a fraction of current values and never sold a piece of it, and argued that kind of appreciation does not happen in secondary markets. He described a recent California purchase in a submarket where the average home price is around $2 million and ownership carries a monthly payment in the low teens of thousands, while his building rents at roughly $4,000 a month to people who cannot put half a million dollars down.
A third panelist reframed the question. He described Dallas, Phoenix, Las Vegas, and Orlando as primary markets in his own view, distinguishing them from core coastal markets he does not want to be in, and said what matters is being in primary locations inside high-growth states instead of reaching for tertiary cities. His properties sit surrounded by million-dollar homes while renting at around $1,200, and he noted that land and replacement value run roughly three times the value of the property itself. His read on the sector was blunt: the problems in multifamily are not operational, because the housing shortage is real and demand is there. The problems come from the debt and capital markets.
Weiner’s summary of why he does it this way was the most quotable line of the session. His firm does not believe in sex, he said, it believes in boring cash flow.
The panel’s discipline on debt levels comes from having watched the alternative. Dana Rowan, Managing Partner of The Exeter Companies, described a persistent tendency to put too much debt on assets given how volatile the market has been, noting that the world has been turned upside down several times over the past five to seven years. She also flagged a second habit she considers a fault, which is owners accumulating and carrying far more land than they need while chasing entitlement opportunities.
Her memory of the pre-crisis market is specific. Lenders were writing what she called one percenters, and a single debt fund would write 90 percent of the debt and 90 percent of the equity on the same deal. Her team called those credit card deals. Some of those commitments were pulled before they were ever executed, and a great deal of the lending was done without guarantees, which people described at the time as free money. That game, in her words, is over, and she described banks and private lenders alike as considerably more disciplined today. She has seen development deals get to 85 or 90 percent and thinks some can be justified, but does not think an owner wants to be there.
Manoucheri put his own discipline in numbers. His firm holds to 60 to 65 percent maximum loan-to-value nine times out of ten, because putting 35 or 40 percent down leaves a far better position on secure cash flow. He described a California acquisition bought at a 5.25 going-in cap rate with debt locked at 5.15 percent, a very thin positive spread, and said the trick was to avoid overburdening the property.
He also drew the line back to the last crisis. Cap rates compressed to three and a half to four and a half after Covid, which he called ridiculous, and have since moved to at least five, reaching six and a half in some secondary markets. He recalled walking away from a Central Park acquisition before the financial crisis at roughly a four and a half cap when the ten-year Treasury was near six, on the grounds that the math did not work, and pointed at deals bought at a negative spread to debt cost as a cause of what followed in 2008.
Comeau added the lender-side version from his own deals: they are not permitted above roughly 65 percent, stabilized assets should sit lower and non-recourse, and the old practice of pressuring an appraiser toward a helpful number is, in his words, pretty much gone.
Manoucheri’s long-term model shows what the discipline is for. On his private platform he owns more than half of the assets with his own capital and describes the business as never sell, refinance every three to five years. His firm has done that as many as five times on a single asset, taking the basis from 15 to 23 times over, and holds those assets for cash flow. The institutional side runs a value-add program on a three to ten year hold. None of that is available to an owner who used the covenant as the target.
An owner holding substantial headroom still needs to know which calculation the loan documents actually use, because the two are frequently not the same. The Fannie Mae Multifamily Guide is a useful illustration because it defines the terms precisely, and four of its mechanics move the ratio.
The same rulebook also carries several distinct coverage tests, an underwritten ratio at origination, a monitored ratio used in quarterly review of credit facilities, and a minimum conversion ratio applied when an adjustable rate loan converts to fixed. An owner tracking one number is tracking the wrong one at least some of the time. For reference on the floors themselves, Fannie Mae’s Near-Stabilization execution term sheet sets a minimum underwritten DSCR of 1.25x at a Tier 2 level, or 1.15x for affordable housing loans, against a maximum 75 percent of as-stabilized value.

Most owners handle all of this by hand. An analyst re-spreads the statements to the covenant definition, applies the normalizations, recalculates, and compares against the loan agreement. It happens quarterly at best, it happens one asset at a time, and each rebuild is a chance for the numbers to drift between analysts. None of that work is the part requiring judgment.
Smart Capital Center defines the calculation once and runs it continuously. A separate configurable covenant column holds the covenant-specific coverage logic, which can match core underwriting or differ from it, so the number being tested is the one the documents govern instead of an approximation. Coverage and occupancy are calculated in real time as soon as financials post. Standard adjustments such as management fee percentages and property tax gross-ups are normalized as configured or pulled from the systems a team already uses. Where data across systems disagrees, the platform extracts from the loan agreement itself and reconciles against the records, because the agreement is what governs the test.
Agentic AI handles the reconstruction around it, reading borrower files, market comparables, and hard-to-find web sources, then finding the patterns that sharpen the analysis. Any figure traces back to the exact passage in the source document it came from. A whole portfolio can be re-underwritten at once, so a move in rates or a change in rent assumptions gets tested across every asset instead of one at a time. When a test indicates a problem, the system writes a plain-language note and recommends the next step, and a person decides whether to take it. Analysts get their time back for sizing, structuring, and credit terms.
Coverage is not a compliance metric bolted onto the end of an underwriting. The owners on this panel treated it as the thing that lets a firm survive a cycle, which is why one of them runs 2.75 to 3.5 times against a 1.25 requirement and another caps loan-to-value at 60 to 65 percent nine times out of ten.
Both of them were describing the same lesson from the same decade. Deals bought at a negative spread to debt cost, and debt funds writing 90 percent of the capitalization, produced the last workout cycle. Headroom is what an owner buys instead of proceeds, and it is the reason a never-sell model that refinances every three to five years is available to some firms and not others.
Knowing which definition governs each loan, and testing against it in real time instead of quarterly, is the difference between managing a coverage issue and discovering one. Book a Smart Capital Center demo today.
Q. What is the debt service coverage ratio?
A. It measures whether a property generates enough income to cover its debt payments, calculated as net operating income divided by annual debt service. A ratio of 1.25 means the property produces 25 percent more income than it needs to make its payments. Agency and loan-document definitions frequently use net cash flow instead of net operating income in the numerator.
Q. How do you calculate the debt service coverage ratio?
A. Divide annual net operating income by annual debt service. What matters is the detail inside each term. Debt service may be calculated on an assumed amortization schedule instead of actual payments, and may include required mezzanine or preferred equity payments. The numerator may be reduced by replacement reserves and other adjustments to arrive at net cash flow.
Q. What is a good debt service coverage ratio in commercial real estate?
A. The covenant floor and the operating level are different questions. At the 2026 IMN private funds conference, a retail owner described community banks wanting 1.25 coverage on enclosed malls while his own firm runs 2.75 to 3.5 times, and put open-air center expectations at 1.75 to 2 times. Fannie Mae’s Near-Stabilization execution sets a minimum underwritten ratio of 1.25x at a Tier 2 level, or 1.15x for affordable housing loans.
Q. How much coverage headroom should an owner hold?
A. There is no standard, and the owners on the 2026 IMN panel treated it as a judgment about surviving volatility. One described running two to three times the bank requirement in secondary-market retail. Another capped loan-to-value at 60 to 65 percent nine times out of ten, on the reasoning that putting 35 to 40 percent down produces a better position on secure cash flow.
Q. Why is my coverage ratio different from my lender’s?
A. Usually because the definitions differ. The lender may test net cash flow instead of net operating income, calculate debt service on an assumed amortization term instead of an interest-only payment, apply an interest rate floor instead of the note rate, or count mezzanine and preferred equity payments as debt service. Each moves the ratio, and they compound.
Q. Can the debt service coverage ratio be below 1.0?
A. Yes. A ratio below 1.0 means the property is not producing enough income to cover its debt payments, and the shortfall has to be funded from reserves, from the sponsor, or from another source. It generally signals a covenant breach, and the consequences are set by the loan agreement.
Q. How can an owner track coverage across a whole portfolio?
A. Smart Capital Center uses a separate configurable covenant column so the covenant-specific calculation can differ from core underwriting, calculates coverage and occupancy in real time as financials post, and re-underwrites a full portfolio at once when rates or rent assumptions move. Every figure traces back to the passage in the source document it came from.