CRE Lenders

October 26, 2026
CRE Lenders
October 26, 2026

An offering memorandum arrives with a polished rent roll summary, a pro forma that clears your return target, and three comps that all support the ask. You have a few days to decide whether to bid. Every number in it came from the listing broker, whose job is to sell the property at a strong price, and rebuilding the financials from the underlying documents takes longer than the bid window allows. Newmark's 2Q26 U.S. Capital Markets Conditions & Trends report puts first-half 2026 transaction volume at $293 billion, up 31% year over year, so more of these OMs land on the same desks.
More deal flow makes it worse. Every OM behind those deals is built differently, with its own trailing periods, expense groupings, and comp sets, and each one needs its own check. The Real Estate Roundtable's first-quarter survey points to more of them coming:
"This quarter's survey shows the market is stabilizing, with improving debt availability."
Jeffrey DeBoer, President and CEO, The Real Estate Roundtable, Q1 2026 Sentiment Index, February 20, 2026
A principal at a CRE investment firm described one of the places to look:
“There are going to be other cases when the broker's offering memorandum is only selecting two, three, four comps that serve their purpose of getting a high price, when in fact there may be four or five other more appropriate comps that the broker hasn't showcased.”
A principal at a CRE investment firm
Smart Capital Center puts OM numbers, historical financials, and third-party reports side by side on the same chart of accounts. For the acquisitions analysts and underwriters using it, that means:
● Gaps show up in minutes. OM figures sit next to the historical operating statements on one chart of accounts, so a different trailing period or expense grouping is visible right away.
● The broker's comps get a second opinion. Smart Capital Center benchmarks them against a wider comp set, so an analyst can see which comps were left out.
● Every figure traces to its document. Each number links back to the page it came from, so the verification holds up in investment committee or credit committee.
This article covers what an offering memorandum is, what it includes, which numbers to verify, the red flags that matter, and a checklist to run on your next OM.
An offering memorandum, or OM, is a marketing document that a listing broker prepares to present a commercial property for sale. It describes the property, summarizes its income and expenses, and gives comps and market context to prospective buyers. An OM is written to support the asking price, so a buyer treats it as a starting point for analysis.
● Offering memorandum (OM): a marketing document prepared by the listing broker that presents a property for sale, with property details, financial summaries, comps, and market information.
● Listing broker: the broker hired by the seller to market the property and run the sale process.
● Pro forma: a projection of future income and expenses, built on assumptions about rents, vacancy, and costs.
● Trailing period (T1, T3, T6, T12): the number of most recent months of actual results behind a figure: one, three, six, or twelve. The T-12 is the full trailing twelve months of operating statements.
● Rent roll: a list of each unit or suite with its tenant, lease dates, rent, and square footage.
● Chart of accounts: the standard list of categories used to group income and expense line items.
● Exit cap rate: the capitalization rate assumed for the sale of the property at the end of a hold, used to estimate future value.
● Agentic AI: AI that carries out multi-step work on its own, pulling from documents and external sources and reconciling what it finds, then handing conclusions to a person to decide on.
The listing broker prepares the OM on behalf of the seller, usually from the seller's operating statements, rent roll, and property records. The broker chooses the trailing periods, the expense categories, the comps, and the market assumptions. Those choices are where a buyer's verification should concentrate.
Most commercial real estate offering memoranda follow the same outline, and each section is built by the broker.
The overview covers location, size, unit or suite mix, year built, and the investment highlights. The rent roll summary condenses lease-level detail into occupancy, average rent, and lease expirations.
Historical statements show what the property earned and spent. The pro forma shows what the broker projects it will earn under new ownership. Both appear in the OM, and they are often built differently.
Sales comps support the price. Rent comps support the rent assumptions. The market overview supports the growth story behind the pro forma.
Everything in an OM is selected and presented to support the price the seller wants. That does not make the numbers wrong, and it does mean the choices behind them need checking: which period, which comps, which expense grouping. An OM is a starting point for analysis.

Five areas carry most of the risk, and each one sits in what the broker chose to show.
A broker can use the trailing period that shows each line in its best light, such as T-3 for revenue when rents are rising and T-12 for a line where the full year looks better. A CRE investor described the difference between brokers:
“The most favorable numbers, whether it's a T1, a T3, a T6, for different things they want to show in the OM. The good brokers will have notes in there telling you, we're using the T6 for this, and here's why. The less than forthright brokers will not have those notes.”
A CRE investor
Ask which period each line uses and why. If the OM does not say, rebuild the line from the monthly statements.
OM expense categories often differ from the property's actual operating statements. A cost moved between repairs, payroll, and management, or grouped under “other,” can hide a trend. Map both documents to one chart of accounts before comparing.
A broker picks the comps that fit the story. Pull a wider comp set by submarket, asset class, vintage, and date, and compare it with the broker's list. If better-fitting comps were left out, the price conversation changes.
Verified pricing evidence is thin to begin with. According to NCREIF's Trends Report, roughly 500 properties in the NCREIF Property Index sell in a given year, and only for those sales does the actual sale price replace the appraised value normally used. A broker's two or three comps are a small slice of an already small pool, which is why a wider comp set matters.
Check unit count, rentable square footage, and unit mix against the actual rent roll. Small differences change rent per square foot, revenue per unit, and the value built on them.
Check each assumption against the submarket's recent history and current market data. An exit cap rate below the going-in cap rate, or rent growth well above the submarket's history, lifts the projected return without any change to the property.
Two public benchmarks help frame the check. Newmark's 2Q26 report found that transaction cap rates held largely flat outside industrial through the second quarter, so an exit cap rate that assumes compression needs its own support. For residential rental properties, the U.S. Census Bureau reported a national rental vacancy rate of 7.3% in the second quarter of 2026, against 7.0% a year earlier. That national figure covers all rental housing, so compare the OM's vacancy assumption with submarket data and use the national rate only as context.
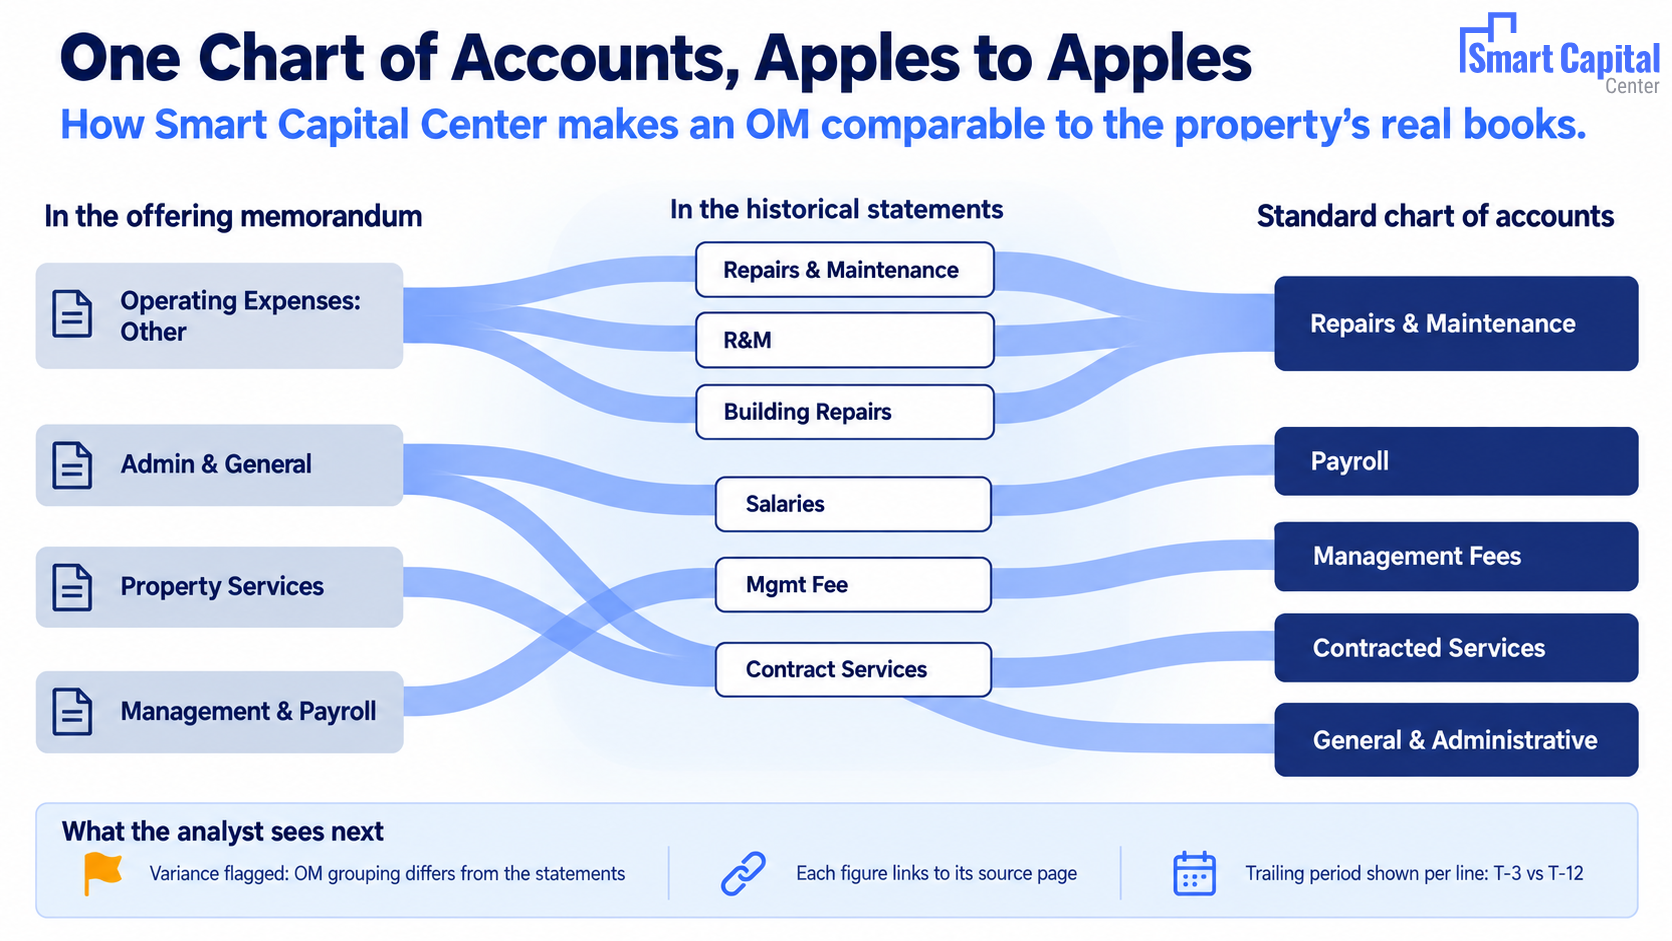
Historical financials report what happened. A pro forma reports what the broker believes will happen under new ownership. The pro forma may also use a different trailing period and a different expense grouping than the historicals, so the two cannot be compared line by line until they share one structure.
Take a 120-unit multifamily property. The T-12 shows NOI of $1,143,000. Annualizing the most recent three months, which a broker may choose when rents are rising, lifts it to $1,240,000. The OM pro forma shows $1,323,000. At a 5.75% cap rate, the three NOIs imply values of about $19.9 million, $21.6 million, and $23.0 million.
Illustrative example, not client data.
The $3.1 million spread between the T-12 value and the pro forma value comes from the period chosen, the expense grouping, and the revenue assumptions. The building has not changed. Each piece needs a source before the bid reflects it.
● No notes on which trailing period each line uses.
● Pro forma NOI far above T-12 NOI, with no bridge between them.
● Expenses grouped under broad headings such as “other” or “miscellaneous.”
● A comp set of only two or three properties, or comps with no addresses or dates.
● Unit count, square footage, or unit mix that does not match the rent roll.
● A vacancy assumption below the submarket's recent vacancy.
● An exit cap rate below the going-in cap rate, or rent growth well above submarket history.
● Missing months in the operating statements, or an unexplained gap between rent roll income and T-12 income.
1. Ask which trailing period each line uses. Request the monthly statements behind any line the OM does not explain.
2. Map the OM and the historicals to one chart of accounts. Compare expenses category by category, not by the broker's headings.
3. Reconcile pro forma NOI to T-12 NOI. List every bridge item between the two and its source.
4. Tie the property facts to the rent roll. Check unit count, square footage, and unit mix.
5. Pull a wider comp set. Compare it to the broker's comps by submarket, asset class, vintage, and date.
6. Test the market assumptions. Check rent growth, vacancy, and exit cap rate against current submarket data.
7. Check the OM against third-party reports. Compare it to the appraisal, property condition report, and other outside documents.
8. Record every variance and its source. Keep the file ready for investment committee or credit committee.
For the wider diligence process around these steps, see Due Diligence for CRE Investors: Checklist and CRE Due Diligence Platform vs. Manual Review.

The work in an OM review is mostly data work: pulling figures out of a PDF, putting them on a common structure, and checking them against a wider set of evidence. That is the part AI can speed up, and the analyst keeps the judgment.
Smart Capital Center's agentic AI reads the OM and pulls the rent roll summary, operating figures, pro forma, and comps into structured data, so nobody retypes numbers from a PDF.
OM numbers and historical financials go onto the same chart of accounts, next to each other. Laura Krashakova, Founder & CEO of Smart Capital Center, explains the approach:
“The pro forma that's in the offering memorandum shows a somewhat different breakdown between expenses versus the detail that you may have in historicals. So we put everything apples to apples. We convert everything to the same chart of accounts.”
Laura Krashakova, Founder & CEO, Smart Capital Center
A different expense grouping, trailing period, or unit count shows up in minutes. Centers Dynamic Partners underwrites deals 4x faster with Smart Capital Center.
Smart Capital Center benchmarks the broker's comps and assumptions against 120M+ properties, 1B+ signals, $500B+ analyzed, so an analyst can see which comps were left out. The analyst decides what the property is worth. For the valuation methods behind that call, see How to Value a Commercial Property and 5 Best Metrics to Evaluate Commercial Property Investments.
The biggest risks in an offering memorandum sit in what the broker chose to show: the trailing period, the comp set, and the expense grouping. Smart Capital Center's agentic AI puts the OM, the historical financials, and third-party reports side by side on one chart of accounts, so those choices are visible in minutes. The analyst reviews the gaps and makes the call on price.
See an offering memorandum and the historical financials side by side on one chart of accounts.
Book a demo with Smart Capital Center →
Q: What is an offering memorandum in commercial real estate?
A: An offering memorandum, or OM, is a marketing document prepared by the listing broker to present a commercial property for sale. It describes the property, summarizes income and expenses, and includes comps and market context. Because it is written to support the asking price, a buyer treats it as a starting point for analysis.
Q: What does a commercial real estate offering memorandum include?
A: Most OMs include a property overview, a rent roll summary, historical operating statements, a pro forma, sales and rent comps, and a market overview. The broker chooses how each section is built. That includes the trailing period, the expense categories, and the comp set.
Q: Who prepares an offering memorandum?
A: The listing broker prepares it on behalf of the seller, usually from the seller's operating statements, rent roll, and property records. The broker's job is to sell the property at a strong price. A buyer should verify the numbers independently.
Q: Which numbers in an offering memorandum should I verify first?
A: Start with the trailing period behind each financial line, then the expense categories, the comps, the unit counts and square footage, and the market assumptions. These are the areas where the broker's choices have the most effect on value. Rebuild any figure you cannot trace to an operating statement or the rent roll.
Q: How is an OM pro forma different from historical financials?
A: Historical financials report what the property earned and spent. A pro forma projects what the broker expects under new ownership, and it may use a different trailing period and expense grouping than the historicals. Put both on one chart of accounts before comparing them.
Q: What are common red flags in an offering memorandum?
A: Common red flags include no notes on the trailing period, a pro forma NOI far above the T-12 with no explanation, and expenses grouped under broad headings. Others are a short or incomplete comp list, unit counts that do not match the rent roll, and an exit cap rate below the going-in cap rate.
Q: How can AI speed up offering memorandum review?
A: Smart Capital Center's agentic AI extracts the OM's figures, maps them to one chart of accounts next to the historical financials, and benchmarks the broker's comps against a wider comp set. Gaps show up in minutes, and the analyst decides what they mean for the bid. Centers Dynamic Partners underwrites deals 4x faster with Smart Capital Center.