Smart Capital News
June 16, 2026
Smart Capital News
June 16, 2026
According to the Mortgage Bankers Association’s 2026 Commercial /Multifamily Mortgage Maturities Report, approximately $957 billion in U.S. commercial real estate mortgages will mature in 2026 alone — a 3% increase over 2025, and the continuation of a cumulative $2.7 trillion maturity wall extending through 2028. For institutional investors holding CRE on the balance sheet and for the banks, CMBS conduits, and debt funds that originated those loans, the question is no longer theoretical: what percentage of this wall refinances cleanly, what percentage requires structural intervention, and where do the loss-severity hits land.
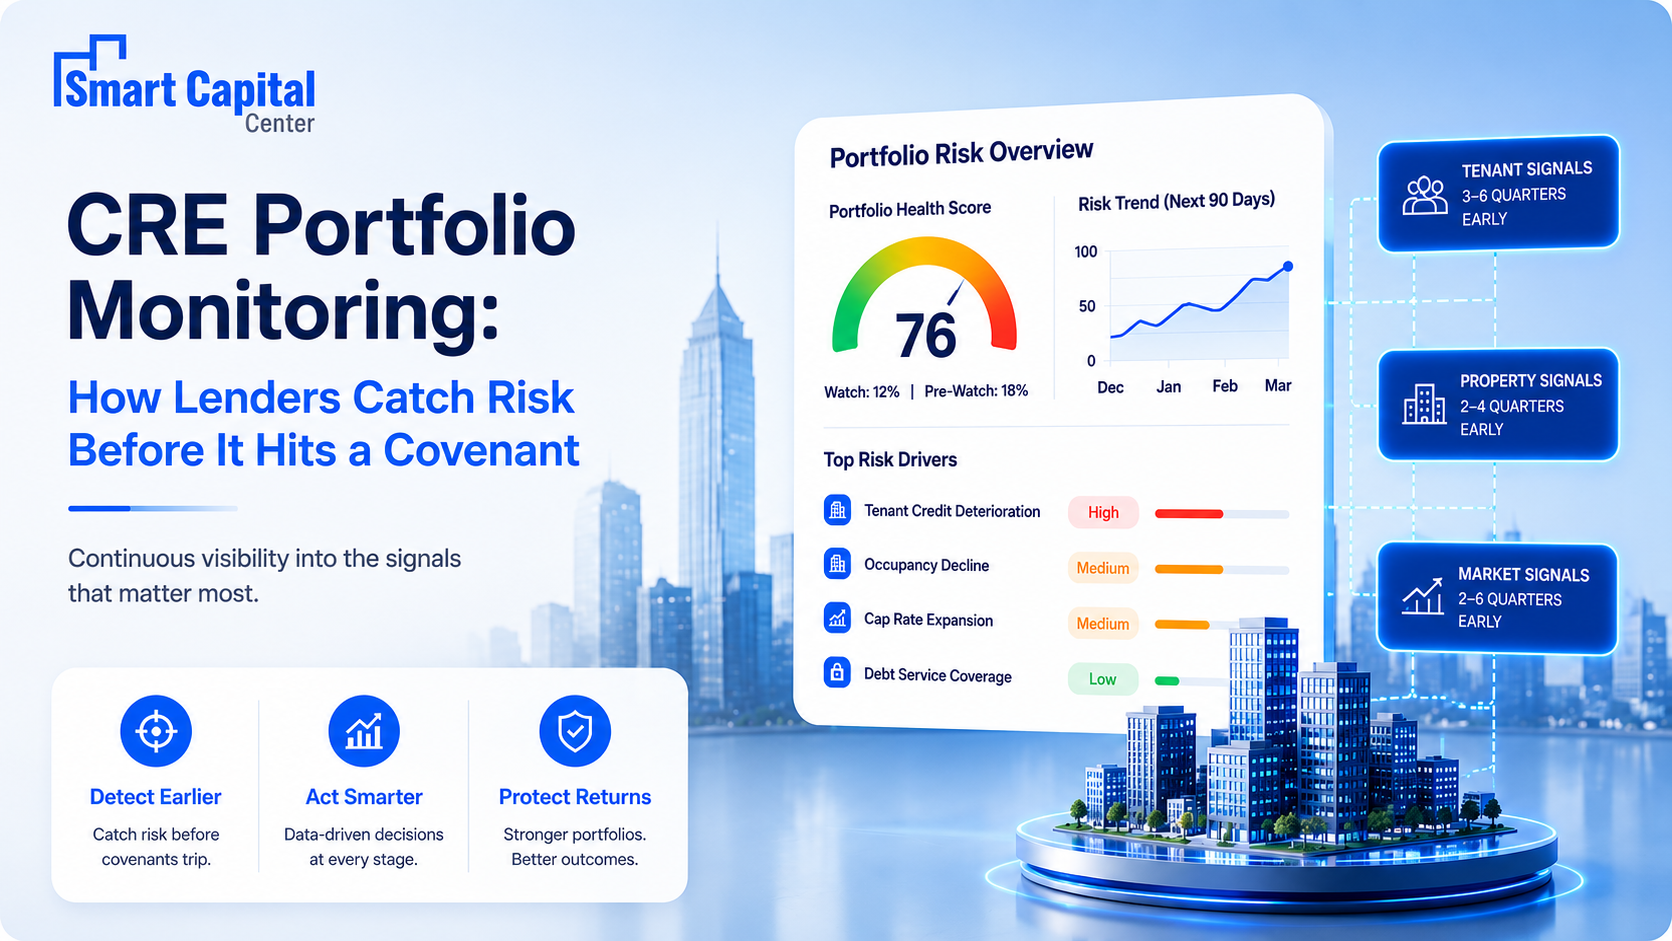
The answer depends on four variables institutional CRE teams are now tracking in realtime: the level of the 10-year Treasury at the moment of refinance, the property’s current value relative to its basis, the property’s DSCR undercurrent insurance and operating costs, and whether the borrower can close a capital-stack gap through creative financing. Smart Capital Center — the AI-powered CRE platform used by KeyBank, JLL, The RMR Group, and Gantry to monitor portfolio-level refinancing risk in real time — is the analytical lens for this article.

The CRE debt maturity wall is the aggregated volume of commercial real estate mortgages scheduled to reach contractual maturity in a defined period — typically measured annually and by lender segment. Maturity itself is routine: most CRE loans are structured with 5-, 7-, or 10-year terms and a balloon payment at the end, which the borrower satisfies by refinancing, selling the property, or negotiating an extension with the lender. The “wall” language comes from the 2024–2028 window, in which an unusually large volume of loans originated during the 2014–2019 low-rate era reaches maturity simultaneously into a materially higher-rate refinancing environment.
Three conditions determine whether a maturing loan refinances cleanly or enters distress:
1. Refinance proceeds cover the outstanding balance.The property value, at current cap rates, must support a new loan at prevailing LTV standards (typically 60–70% for bank-held CRE, 65–75% for CMBS).
2. The refinanced loan cashflows. The property’s current NOI, net of current insurance and operating expenses, must support DSCRat the new (higher) interest rate.
3. The lender is willing. The originating lender —or a replacement lender — must be willing to extend credit, which for regional banks with elevated CRE concentration has become a material constraint.
When any one of these three conditions fails, the loan enters a refinancing gap: the difference between what the borrower owes at maturity and what a new lender will advance.The gap is filled by borrower equity, mezzanine debt, preferred equity, a discounted payoff, an extension with modification, or — increasingly in 2026 — a structured workout.
Worked example. A 2017-vintage $40M office loan on a Class B suburban asset in a secondary market was originated at 4.25% interest and 65% LTV against a $61.5M value. At 2026 maturity, the property now appraises at $42M (a 32% peak-to-trough decline consistent with the Green Street Class B office index), current NOI has declined 18% from origination due to higher vacancy and insurance, and prevailing 10-year financing prices at 6.75%. A new lender underwriting to 60% LTV and 1.25x DSCR can advance approximately $23M. There financing gap is $17M — 42% of the maturing balance. Closing it requires equity pay down, structured subordinate capital, or a lender modification. This is not an edge case in 2026; it is the median workout profile across Class Band C office and retail in secondary and tertiary markets.
The 2026 maturity wall is not uniform. It concentrates heavily by property type, by lender segment, and by geography. The data below reflects the operating environment as of early 2026:
The pattern reads consistently across every source: the 2026 maturity wall is disproportionately concentrated in depository-held office and retail debt, in markets where property values have not recovered, and where the current cost of refinancing now exceeds the income-supporting capacity of the asset.
Five drivers determine whether a maturing 2026 CRE loan refinances cleanly or enters a capital-stack gap. Each operates independently — together they explain why this maturity wall is structurally different from any prior cycle.
The 10-year Treasury — the benchmark against which most fixed-rate CRE debt prices — sat at an average of 2.0% during the 2014–2019 vintage origination window and at 4.12% in April 2026. For a loan originated at 4.25% refinancing at 6.75%, debt service on the same principal balance increases by approximately 59%, which on most property types consumes 100–150 basis points of debt yield. Properties underwritten against 2019-era rates simply do not cashflow at 2026 rates without either higher NOI, lower principal, or both. The Fed’s 2025 rate-cutting cycle has partially moderated the pressure, but the 10-year has not returned to origination-era levels and is not forecast to.

A loan originated at 65% LTV against a $61.5M value holds through maturity at a contractually amortized balance — but the new lender underwrites against current value, not basis. For office assets in secondary and tertiary markets, that current value sits 28–38% below 2022 peak levels. The resulting LTV gap —between what the borrower owes and what a new lender will advance — is the structural source of the 2026 refinancing gap. For institutional investors using Smart Capital Center’s AI-powered portfolio monitoring to mark their CRE positions to current market in real time, the LTV gap is a known quantity at every asset in the portfolio —not an end-of-quarter surprise.
CRE property insurance premiums have risen 47% cumulatively from 2023 through 2025, driven by catastrophe exposure (particularly wind and fire), reinsurance market dislocation, and carrier withdrawal from coastal and wildfire-exposed markets. For a multifamily property carrying a $180,000 annual insurance premium in 2022, the 2026 premium is now approximately $265,000 — directly reducing NOI by $85,000 and, at a 6.75% refinance rate, reducing supportable debt by approximately $1.1M per property. Across a portfolio of 200 assets, the cumulative DSCR erosion from insurance alone can shift hundreds of millions insupportable debt.
The Federal Reserve’s dual mandate — price stability and maximum employment — shapes the rate environment CRE refinances into. The Fed’s 2025 easing cycle was conditioned on PCE inflation trending toward 2% and the unemployment rate remaining near 4%. Any re-acceleration on either front — through an energy price shock, supply chain disruption, or wage pressure — would halt or reverse the current easing path. For CRE borrowers with 2026 maturities, the timing of the refinance matters materially: a refinance closed at the current 4.12% 10-year prices meaningfully differently than one closed at a hypothetical 4.75%.
Where the conventional senior refinance cannot close the gap, institutional borrowers are deploying a combination of subordinate capital structures: mezzanine debt to bridge the LTV differential, preferred equity to avoid mezzanine covenant constraints, joint ventures with new equity partners to pay down principal, LIHTC equity for qualifying multifamily assets, green bonds for retrofit-driven recapitalizations, and opportunity zone investment for assets in designated tracts. What was niche structured finance in 2019 is now mainstream recapitalization machinery in 2026 — and institutional teams working through a maturity calendar use Smart Capital Center’s optimal financing sourcing to identify and run the full capital-stack process in parallel.

The 2026 maturity wall creates distinct risks for borrowers, lenders, and institutional investors. Each has a specific mitigation that must be addressed before, not during, the refinance window.
The most immediate risk is the capital-stack gap at maturity. Borrowers who enter there finance window without a complete picture of current property value, current NOI, current insurance position, and current market financing terms are negotiating from incomplete information — which translates directly into worse outcomes. The mitigation is portfolio-level refinancing visibility: every asset in the portfolio should have a real-time projected refinance balance, refinance gap, and capital-stack solution identified 12–18 months before the maturity date.
Regional and community banks hold 43% of 2026 CRE maturities — the largest single lender segment. For institutions with concentrated CRE loan books, a wave of maturity-driven workouts, modifications, and discounted payoffs translates directly into loss severity on the portfolio. Under current OCC and FDIC guidance on CRE concentration risk, banks are required to maintain documented, real-time monitoring of maturity-driven stress across the portfolio. Banks that cannot demonstrate this monitoring at examination face direct regulatory exposure in addition to the credit exposure.
The 47% cumulative rise in CRE insurance premiums is not evenly distributed. For assets in wildfire-exposed, flood-exposed, or wind-exposed markets, carrier withdrawal has created situations where property insurance is either unavailable at any reasonable premium or available only through surplus lines carriers at 2–3x standard pricing. A refinancing loan cannot close without insurance; an uninsurable asset cannot refinance. Institutional teams evaluating portfolio refinancing risk must now track insurance availability and pricing as a first-order underwriting input, not an afterthought closing item.

The 11.2% 30+day delinquency rate in office CMBS is not a forecast — it is the current reality. For CMBS holders and for debt funds whose LP reporting depends on real-time loan-level performance, the 2026 maturity wall translates into ongoing mark-to-market volatility, special servicing volume, and loss distribution decisions that require institutional-grade data infrastructure to navigate. Debt funds without real-time portfolio intelligence are managing this cycle on lag — which is where LP trust erodes.
The following framework is the one Smart Capital Center has seen deployed across institutional CRE portfolios — both on the investor side (real estate owners facing maturities) and the lender side (banks and debt funds holding maturing credits). Each step maps to a specific operational action.
1. Step 1 — Build a maturity calendar 24 months forward. Every asset in the portfolio should be tagged by maturity quarter. If the calendar cannot be generated from the portfolio system in under an hour, the data infrastructure is the bottleneck.
2. Step 2 — Mark every maturing asset to current market value. Use current cap rates by submarket and property class — not appraised value from origination or the last annual update. Green Street, CoStar, and Smart Capital Center provide current submarket-level benchmarks.
3. Step 3 — Recompute DSCR at current NOI and prevailing refinance rates. Net of current insurance, current operating costs, and current market rent. Properties showing sub-1.20x DSCR at current terms require structured intervention.
4. Step 4 — Calculate the refinancing gap by asset. The difference between outstanding balance and what a senior lender will advance at current terms. Portfolio-level aggregation of the gap determines the scale of subordinate capital needed.
5. Step 5 — Identify the capital-stack solution by asset. Mezzanine, preferred equity, joint venture equity, LIHTC, green bonds, opportunity zone funds, land leases, or extension-plus-modification. Each solution has a specific use case; none is universal.
6. Step 6 — Run an insurance-availability screen. For every maturing asset in a catastrophe-exposed market, confirm insurance availability and 2026 pricing before the refinance window opens. Surprise insurance costs at closing are the most common reason deals fall out of underwriting.
7. Step 7 — For lenders: stress-test the portfolio for loss severity. Run the maturing loan book against base, downside, and severe refinancing scenarios. The severe scenario should assume a 75-basis-point 10-year backup and an additional 10% property value decline.
8. Step 8 — Align portfolio workout capacity with projected volume. Both borrowers and lenders must size their internal workout, asset management, and loan servicing teams to the projected volume of structural interventions. Institutions that attempt to handle elevated workout volume with flat headcount produce downstream errors that compound.
Smart Capital Center executes Steps 1 through 6 across a portfolio in a single unified platform — pulling live market data, current NOI, and real-time financing comparables to produce asset-level and portfolio-level refinancing risk outputs. For institutional lenders, the platform’s intelligent workflow automation for loan servicing extends the same analytical layer to Steps 7 and 8.
The CRE debt maturity wall in 2026 is not a forecast — it is the operating environment institutional lenders and investors are navigating in real time. The institutions working through it successfully are the ones who moved past annual portfolio reviews to real-time, asset-level refinancing analytics, with capital-stack solutions identified 12–18 months before the maturity date rather than assembled in the refinance window itself.
The mathematics of this cycle is unforgiving but not mysterious. Every maturing loan reduces to four questions: what does the property appraise at today, what does it cash flow at today, what will a senior lender advance today, and how do you close the gap between that advance and the outstanding balance. Institutions that can answer those four questions across every asset in the portfolio — continuously, not quarterly — are the ones that will emerge from the 2026–2028 maturity window with their portfolios intact and their LP relationships strengthened.
If your team is working through the same 2026 maturity exposure that institutions across CMBS, bank CRE, and debt fund portfolios are now sizing in real time, the Smart Capital Center team can walk you through portfolio-level refinancing analytics and creative capital sourcing using your own asset list as the reference point.
The CRE debt maturity wall is the aggregated volume of commercial real estate mortgages scheduled to reach contractual maturity in a defined period, most commonly the 2024–2028 window during which an unusually large volume of 2014–2019 vintage loans matures into a materially higher interest rate environment. The wall matters because maturing loans must be refinanced, sold, or restructured — and the combination of elevated rates, compressed property values, and rising operating costs has created a material refinancing gap on many assets.
Approximately $957 billion in U.S. commercial real estate mortgages mature in 2026, according to the Mortgage Bankers Association’s 2026 Commercial / Multifamily Mortgage Maturities Report. This represents roughly a 3% increase over 2025 maturities and is part of a cumulative $2.7 trillion maturity wall extending through 2028.
Depository lenders — primarily banks — hold 43% of 2026 CRE maturities, the largest single segment. CMBS, CLO, and other ABS structures hold approximately 26%, with GSEs, insurance companies, and debt funds holding the remainder. The concentration in depository-held CRE is a material source of regulatory and credit risk for regional and community banks.
A CRE refinancing gap is the difference between the outstanding balance of a maturing loan and what a senior lender will advance at current rates and LTV standards. Institutions close the gap through a combination of structured subordinate capital (mezzanine debt, preferred equity), joint venture equity infusions, LIHTC or opportunity zone investment for qualifying assets, extension-and-modification with the existing lender, or— in some cases — a discounted payoff. The specific solution depends on the asset class, the sponsor, and the lender’s workout posture.
Property insurance premiums have risen 47% cumulatively from 2023 through 2025, directly reducing NOI and therefore reducing the debt service a property can support at refinance. In catastrophe-exposed markets —coastal wind, wildfire, flood — carrier withdrawal has created situations where insurance is either unavailable or available only through surplus lines at multiples of standard pricing. An uninsurable asset cannot refinance, which makes insurance availability a first-order underwriting input for the 2026 maturity wall.
Smart Capital Center provides an AI-powered platform that executes portfolio-level maturity wall analytics end-to-end: automated current valuation against live submarket cap rates, real-time DSCR recomputation at prevailing refinance rates, refinancing gap calculation by asset, and capital-stack solution identification across mezzanine, preferred equity,LIHTC, green bonds, and structured extension options. The platform is deployed in production at institutions including KeyBank, JLL, The RMR Group, and Gantry.
See the same real-time CRE maturity wall analytics institutional teams includingKeyBank, JLL, and The RMR Group now use to manage 2026 refinancing exposure. Book a demo with the Smart Capital Center team today to walk through portfolio-level maturity analytics and capital-stack solutions using your own asset list.


.png)